
There are four important parameters that can be analyzed just using throttle signal from the data acquisition system. These are the followings:
- Throttle speed;
- Full throttle time;
- Full throttle point;
- Coasting.
The main driver activities on throttle occur during corners, a sequency of actions can be summaryzed. The driver approuch to the corner at full throttle (wide open throttle – wot), remove its foot from throttle pedal and brake. However during braking the driver down shift while give some throttle blips to correct the engine speed relative to wheel one. In some point inside the corner the driver starts to re-accelerate. Sometimes the car do not have enough grip to easily accept full throttle and the driver must do some correction on throttle pedal which are called throttle tap or tap dancing. Finally, when the car accept the full throttle, this is called full throttle point. This is a sequency of activities which occur during a cornering approuch just on throttle pedal.
Throttle speed
This parameter is obtained after time derivation of the throttle position sensor signal (read more), thus obtaining a value with percentage/s as unit. This is done by Math window of the softwares as Pi Toolbox and Motec. With this data acquisition parameter it is possible to evaluate the throttle speed which the driver activates the accelerator pedal. Consequently situations as tap dancing and throttle bliping can be visualized. In general these parameters indicates that the car could be unbalanced or the driver is not approuching the turn correctly. In addition it can be analyzed if the throttle bliping is exagerated or not.
Full throttle time
The time at full throttle condition is a graph which illustrate the time spent in the main throttle positions. In general drivers who spend more time at wide open throttle (wot) obtain the fastests laps. They are more assertive to manage the gas pedal during corners avoinding tapdancing to correct some oversteering. However in some cases more time spent at wot can also be an indication of overdriving, in other words, excessive brake pressure at turn in and trying to re-accelerate earlier than normal. The full throttle time is illustrated by a histogram which each bar is a percentage of the throttle position signal and the height of the bars is the time in seconds at that condition or a percentage of the total lap time.
Full throttle point
After the turn-in approuch the driver tries to reach the the full throttle. From the point at the driver begins to re-accelerate until the one that he/she reaches the full throttle can indicate if the driver assertive or careful. The point into the corner exit where the driver reached the full throttle condition is call the full throttle point. This is another metric used to evaluate the driver gas pedal work, but its results is more related to how the driver approuch the corner instead its acceleration technique. It is well known that a bad turn approuch result in an umbalanced car into the corner which difficult the re-acceleration in the exit.
Coasting
In motorsport field coasting means the period which the driver are not accelerating neither braking. In the data analysis softwares (Motec and Cosworth Pi Toolbox) this is given by the following equation:
coasting = (throttle position sensor < 5 %)*(brake pressure < 5 bar)
There is no direct correlation between coasting and lap times, instead of this, a lot of cases show that a driver with minimum coasting can also be slower than one who exhibited more coasting. However there are moments which coasting is good and bad. In general coasting before turn-in unbalance the car and makes more difficult to deal with into the corner. The better coasting usually occurs into the corner. This is performed to balance wheel loads due to weight transfer. Hence it is possible to reach the ideal grip to re-accelerate out of the corner. The coasting can be exhibited in a histogram, which has the same configuration as in throttle time histogram, and in the time/distance charts. In this latter the coasting info can be combined with brake pressure, throttle position sensor (tps) and speed. This make more easy to identify the coasting moments and evaluate if these are benefic or malefic.
Case study
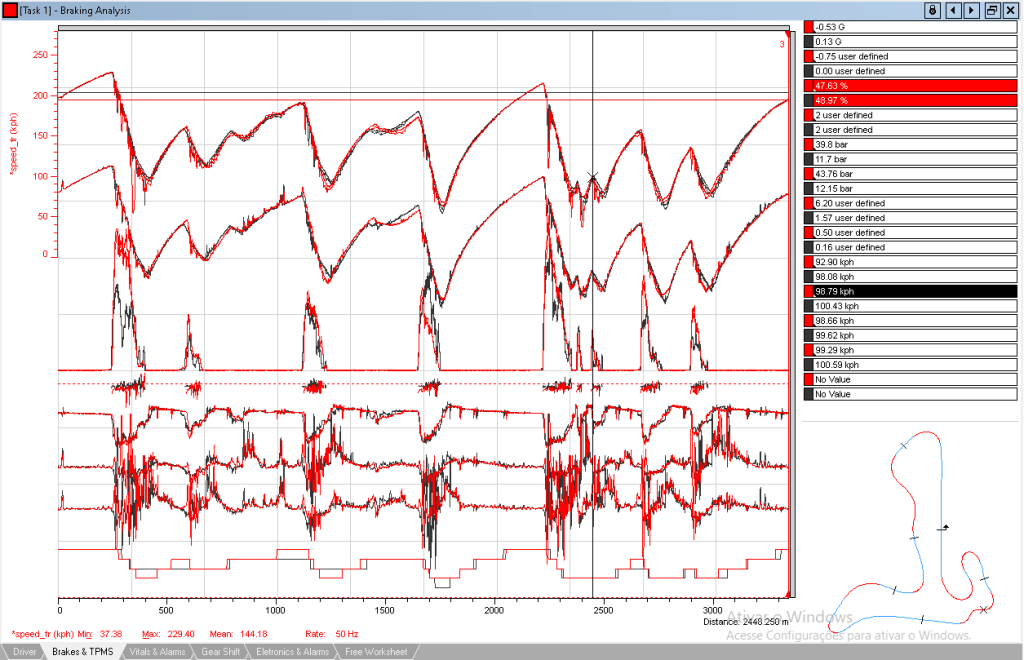
The case choosed is an analysis between two driver, A and B indicated by the colors black and red, in GT race car in the Velocittà racetrack in Brazil. The analysis aims to compare their qualifying laps and tries to retrieve the considerations which justify their laptimes relative each other.
At first sight the driver B, who is 0.38 s slower than driver A, exhibited an aggressive approuch. This can be observed by the brake pressure channels that its curve exhibits a lower slope and higher peak. In addition the reaction time of the driver B is faster than A, which indicates that he/she is a left foot braker. This is quite good in a modern race car, because its transmission system is a sequential one. However this alone do not means that a driver will be faster than the others. As can be seen, a left foot braker can be slow than a driver with convertional brake technique.
Another interesting point observed is the gear used into the corner by the both drivers. The driver B often finds himself at a lower gear than driver A in the same situation. This can be good, but in driver B case the result is in an unbalanced condition into the corner. Analyzing what was happened at turn-in it can be noted that the driver B has an aggressive and longer turn-in braking. This makes it to overcome the corner slower than driver A and under some rear wheel locks due to engine overev. As a result, when driver B tries to re-accelerate, due to the lower speed and acceleration, the car is at unbalanced condition without enough grip sustain the load required for that re-acceleration. Hence the gas pedal tapdancing is often observed in some corner always when driver B is trying to reach full throttle at corner exit. This is one of the main points which driver B lose time relative to driver A. These drivers exhibit great differences in their braking techniques. The driver B exhibit a brake profile which fits well in cars equipped with ABS while driver A seem to be more adequate to car without ABS which is the case of this study.
The driver A exhibit some good pattern as throttle profile which is very assertive in reach the full throttle. Howeve this is motivated by the good corner approuch and a brake profile which fits well with a GT race car without ABS. In addition the period in coasting which the driver A spent is benefic for the car balance inside the corner. This makes possible for it reaches an early full throttle point thus re-accelerating before the driver A.
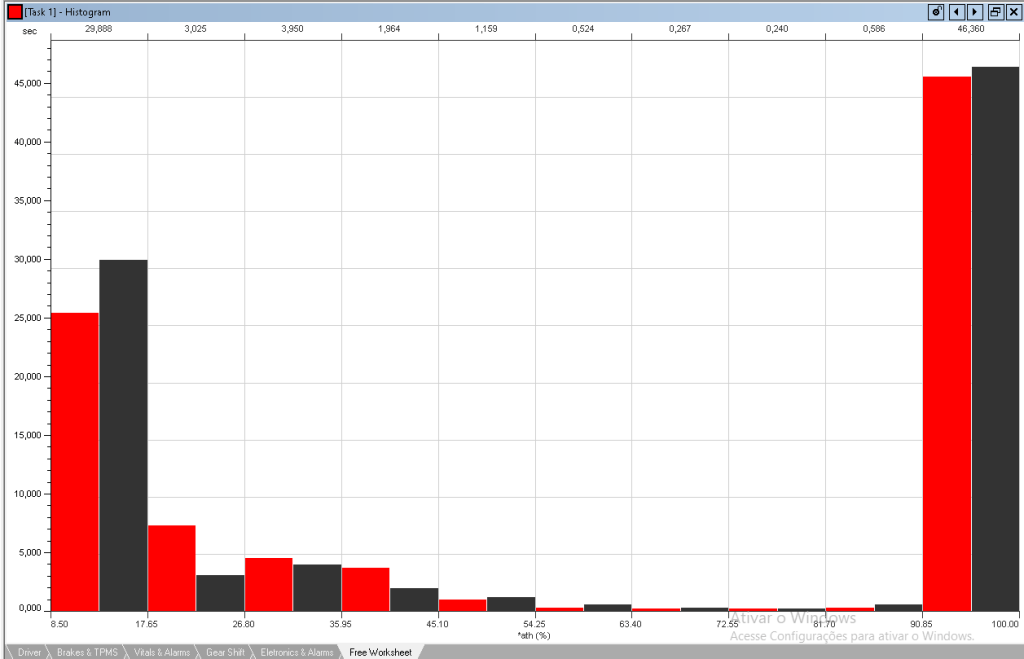
The full throttle histogram indicates an interesting situation. In general the driver which spends the magior part of the lap time at full throttle is the fastest. However the driver A and B have similar amount of time at wot, 45 and 46.36 s, respectively. The driver A spent one second more than B at full throttle condition, but this alone could not be enough to determine the first is the fastest. Indeed no, but analyzing the partial throttle signal it can be seen that the driver B spent more time at this condition, This is another clue that justify the lower lap time from driver A. The driver B finds himself in several moments trying to reach full throttle early, without proper grip. Hence resulting in the gas pedal tapdancing which can be observed in the histogram partial value bars, the driver B dominates this measures.

The full throttle time is the accounting of the time spent under 100% throttle during or the entire outing. Taking a look at this graph it is possible to observate that the driver B spent 45.34 s at this condition while the driver A spent 44.96 s. It is possible to do some statistics:
Driver A = 44.96 / 87.957 = 52.5% at full throttle
Driver B = 45.34 / 88.338 = 54.7% at full throttle
The statistic of this channels differs a little bit relative to the histogram due to the other variables used to compute it, in this case, the lap distance. These values shows that driver B spent more time at full throttle, but do not erase an important factor, where. In the full throttle time graph combined with tps it can be seen that the driver B always try to reach the full acceleration early into the corner, which results in tapdancing due to the lack of grip.
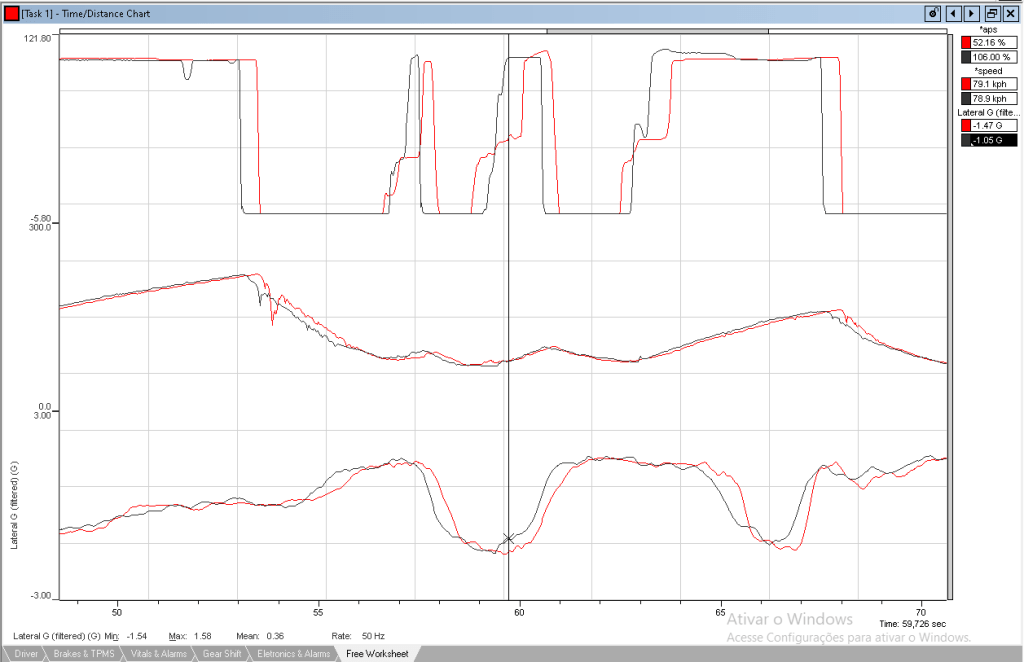
Another statistic is the full throttle point combined with lateral acceleration. Through these two parameters it can be observed if the driver is carefull or assertive. Beginning with the driver A:
– 1.05 / – 1.54 = 0.68 = 68%

Now, observing the driver B:
– 0.98 / 1.57 = 0.62 = 62%
As can be noted, the driver A is assertive when dealing with to the re-acceleration while driver B must correct due to the lack of grip. This result in more time to reach the full throttle. The throttle speed is a math function which can be setted in the data analysis software by deriving the throttle position signal.
Throttle speed = d/dt (throttle)

Hence it can be analyzed how the driver activates the gas pedal. Evaluating the same situation as in the previou paragraph, it can be observed that both drivers have similar throttle activation technique. Although the driver A has a little bit smoother gas pedal work than driver B, this is a result of the driver A turn-in approuch which provides better balance and grip into the corner.
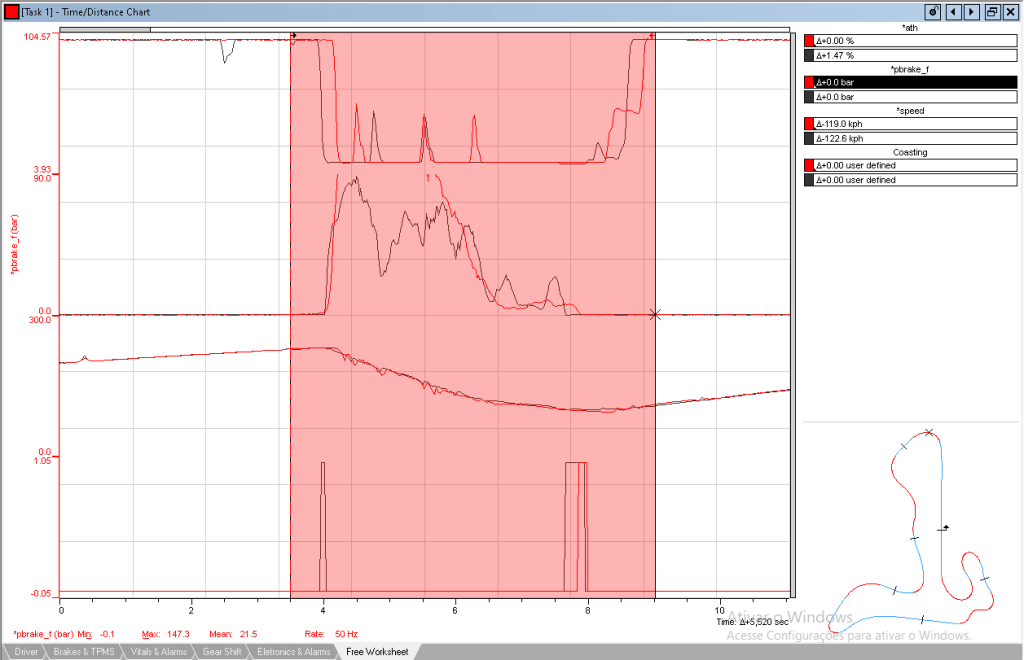
The last point relative to the throttle signal is the coasting. Analyzing the entire lap of both drivers it can be seen that the driver A has much more coasting time than driver B. The driver A exhibits a little coast previous each corner and a significative one inside it. This agrees with the observations made about throttle speed and full throttle point which indicates that the driver A is well succeded in approuch corners without put the car in critical situations. The driver B do not exhibit coasting before braking which confirms that he/she is a left foot braker. This could be an advantage, but this lower coasting cames at cost of very aggressive braking. In addition it always brakes latter than driver A and also try to reach full throttle earlier. The result is a kind of overdriving with continous corrections when trying to reach full throttle.

If the coasting is combined with the lateral and longitudinal acceleration it is possible to visualise how driver A is faster than B. The driver A do not provide a higher deceleration during braking, the bigger coasting inside the corner allows it to re-accelerates latter, but with an early full throttle point.
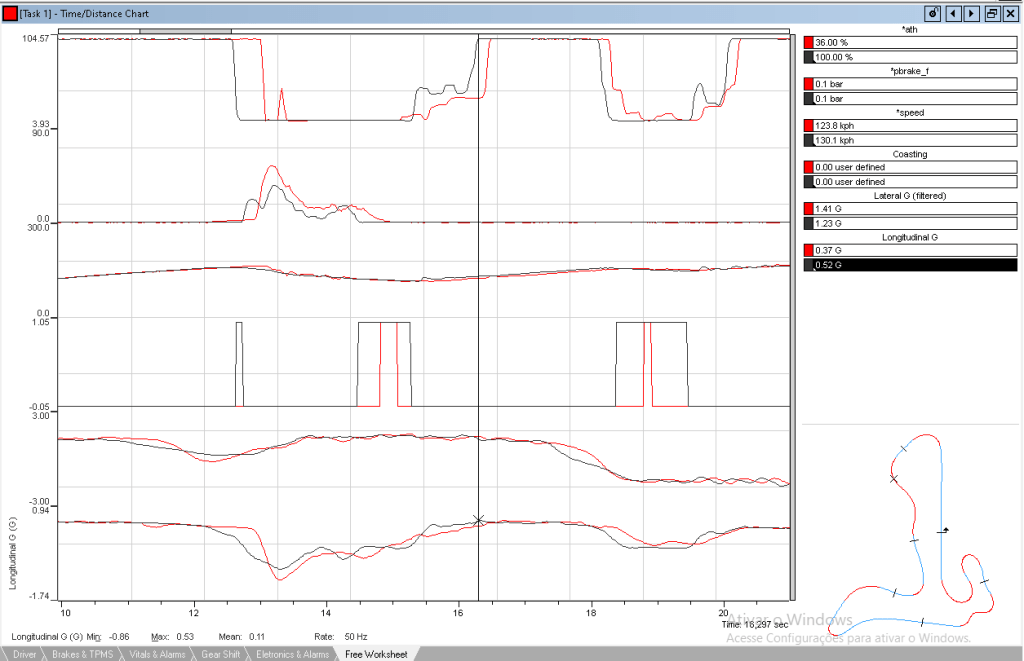
In addition, at parcial throttle (about 40%) the longitudinal acceleration is 0.40 G against 0.10 G of the driver B. This is even more significant when the driver A reaches the full throttle condition, 0.52 G while the driver B is trying to reach wot and just producing 0.37 G if the longitudinal acceleration.
Conclusion
The performance exhibited by the two drivers are distinct, the driver A spent more time at full throttle than the driver B. In addition the latter has higher values of partial throttle position at corner exit. The driver A exhibits coasting previous to each corner which is a clue that he/she is righ foot braker. However this is a very small coasting and during the lap exhibited a good consistency. Its better turn-in approuch when into corner provides more grip to accelerate at corner exit. The driver B has a very aggressive brake pressure curve, but it unbalances the car due to the long braking length and the enormous load spent in longitudinal deceleration. This cause a lack of grip in the rear wheels. Hence the driver B tries to control tapdancing the gas pedal, but it reaches the full throttle latter than driver B and lose time.
Driver A grades
- Performance: 10;
- Response: 8;
- Smoothness: 8;
- Consistency: 10.
Driver B grades
- Performance: 8;
- Response: 6;
- Smoothness: 6;
- Consistency: 9.
References
- Segers. J. Analisys Tequiniques for Racecar Data Acquisition, 1° Edition. Warrendale, PA. SAE International. 2008;
- Segers. J. Analisys Tequiniques for Racecar Data Acquisition, 2° Edition. Warrendale, PA. SAE International. 2014.
