
Tires are components extremely difficult to model. The main reason is due to its non-linearity, but this is not the only factor. There are several factors which compromise a straighforward tire comprehesion. Hence it is important to define a modeling for the tires. In the automotive field two theories are most used, the Tire Brush Model and The Pacejka’s Magic Formula. One is too didatic, but reproduces a good physical correlation between the main tire parameters and the magic formula delivers a good quantitative and qualitative results, but at the cost of the physical connection between tire parameters. However, there are other models proposed to understand tires. The similarity is one of them. This article proposes a brief comment and review of the tire complexity and the tire similarity model.
Tire complexity
There are several reasons which tires are complex to design, the main one is its non-linearity. This occurs due to the hysteresis suffered by the rubber when this is loaded and unloaded alternatively. The deformation suffered during loading is not properly recovered when this is unloaded. In addition, the contact patch is asymmetrical, which results in a rolling resistance load. Another important factor is that tires manage loads in different directions. Constantly they are exposed to longitudinal and lateral loads. Moreover, the camber angle also includes some amount of combined loads on tires. Pressure and temperature are parameters which are not fully controled and they influence directly on the tire grip. The track roughness defines which kind of friction mechanisms are governing the grip, adhesion, cohesion or wearing. Tires are usually modeled as a black box, which inputs and outputs are well defined. In theory, a tire box can be defined as:
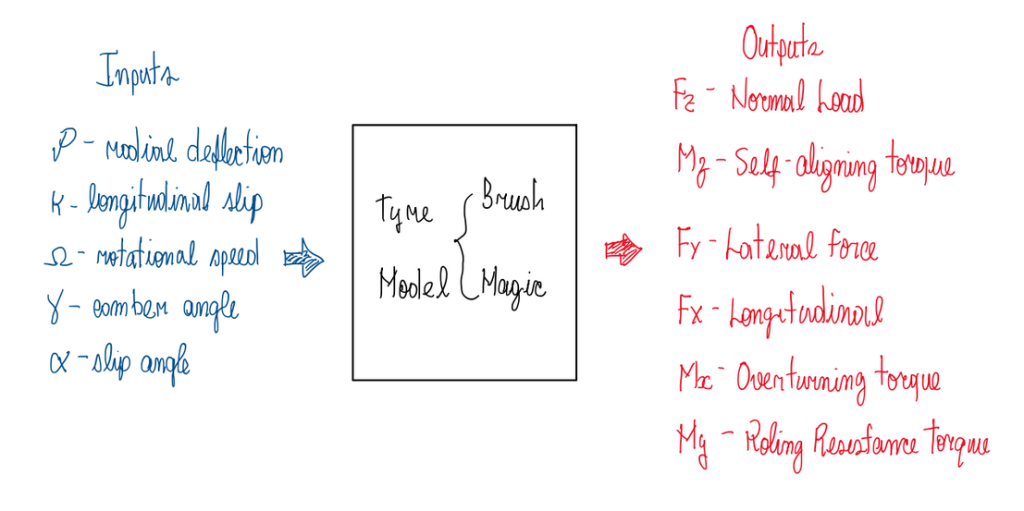
Although the theory indicates the outputs exhibited in the picture, in practice the opposite is what really occurs. It is not possible to define the vertical force (FZ) as an output, once this is primary known. In fact, the real tire has the following input – output relation:

As can be seen, it is not possible to set some theoretical input parameters in real life. This occurs, because some of these can not be applied to the tire during an experiment. However, FZ and the main angles are “easily” applied in a conventional tire test.
The simple tire model

This model is based in the linear correlation between the tire force and slip angle, in other words, a linear cornering stiffness (CY). Therefore, the following equations can be developed:

Where FX, FY, MZ and US are the longitudinal force, the lateral force, the self-aligning torque and understeering angle, respectively. All these parameter are linear functions or combinations of the slip and camber angles. These are related by the longitudinal force, the lateral force and the self-aligning torque by the longitudinal stiffness, the cornering stiffness (CY) and the moment stiffness (CM), respectively. These coefficients are evaluated as tangent lines over the curve, thus at the peak of the lateral (or longitudinal) force, the cornering stiffness or the longitudinal stiffness will be zero.
As can be seen, US defines the instantaneous behavior of the vehicle. This parameter is based in the weight distribution and cornering stiffness. Since tire manufacturers can not provide tires according to the vehicle weight distribution, the vehicle design must establish which is the fundamental behavior of the car. As weight distribution is constant, this parameter is the best way to defined the vehicle characteristics. Although CY is not directly correlated to tires, this is function of FZ and α, this last one are defined by the materials used in the tire structure.

The cornering stiffness changes as the lateral force and the slip angle vary. In fact, it defines the inclination of the linear portion of the tire behavior, the grip phase. After this point, CY is defined by the tangent of each point of the curve. When the lateral force reaches its peak, the cornering stiffness became zero. In this way, the terms b/C or a/C go to infinite. This is the key point of the vehicle behavior. The first axle that reaches the infinity will govern the behavior. Hence, if CfαF goes to zero, b/C goes to infinite which characterize an understeering behavior. In the opposite case, CfαR became zero, the vehicle exhibits an oversteering behavior.
The similarity model
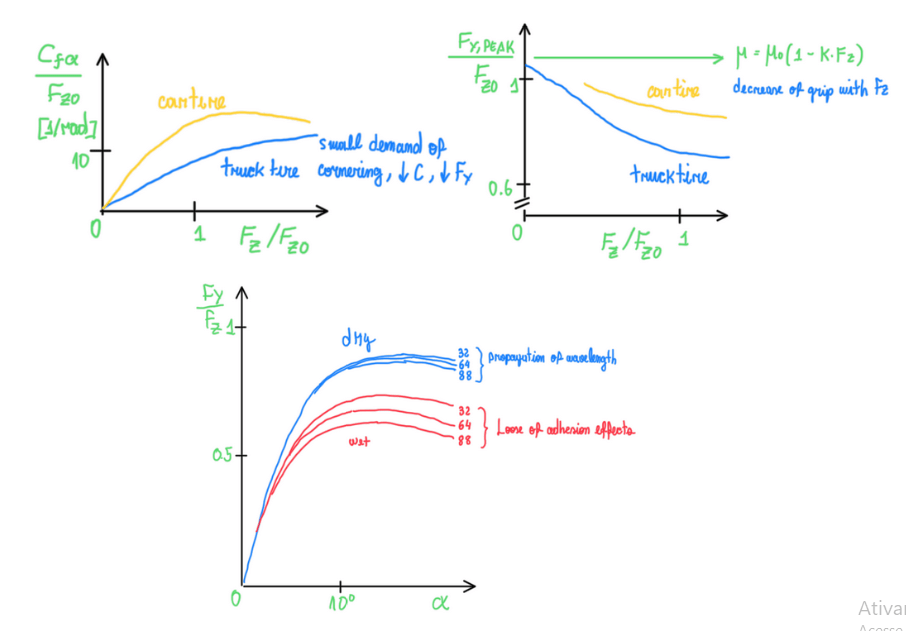
Therefore, after established these relations it is possible to define the so called Similarity model. This was proposed by several authors from the vehicle dynamics field as Milliken and Guiggiani. It is based on the normalization of FY and CY. As this one is force derivation by the slip angle, this is expressed in Newtons per degree. However, the calculation are performed with angles in radians, thus the cornering stiffness unit is N. The first graph in the Figure indicates that the increase of FZ also increase the cornering stiffness (given in this picture as Cf) in cars, because these vehicles must have a high maneuverability. In trucks there is a decay of Cf as FZ increases. This is a condition obtained by the tire material characteristics, which in those vehicles are different. In trucks, the main concern is the load capacity. In the second graph it is even more clear the decay of FY produced by truck tires. Although there is a decrease in car tires, this is expected since the tire grip reduces as FZ increases. The friction coefficient μ (grip) is a function of FZ and the experimental coefficient k. It is interesting to notice the effect of a wet surface. The lost of the adhesion effect drastically reduces FY. However, both curves conditions experiments a slight decay after FY peak. This occurs due to the loss of adhesion and the wave propagation over the tire contact patch for wet and dry conditions, respectively.

If it is pulled together all forces and loads normalized by FZ for each vertical condition, it is possible to visualize that these conditions follows a pattern. The variation in the normalized parameters is basically zero. This is the great finding of the similiratiy model, since it uses the physical properties as can also adopts the magic formula parameters. These points are all measured by tire experiments, but it is always a description of the tire which was tested. Sometimes it is required to understand what happens in situations which are not measured. For these cases, the tire model is proposed. These curves represents the non dimensional FY and MZ, but beyond this, they represent hysteresis, in other words, the tire grip. Hysteresis is grip. Hence, the peak of lateral force is the peak of grip, adhesion, it means that the tire contact patch is in full sliding.
References
- Race Car Vehicle Dynamics – Miliken & Miliken;
- Guiggiani, Massimo. The Science of Vehicle Dynamics. Handling, Braking, and Ride of Road and Race Cars. New York, Springer, 2014.
