For man kind the wheel invention was a huge improvement not only for transportation, but also in the way which load were carried. Before wheels there is no solution rather than dragging objects on the floor, which require the force of many man. Even the Egypt pyramids were built using small cillinders to move the big blocks upwards. When the first wheels were created these are solid ones used in carriages. The main characteristic of a solid wheel is that the contact area is very small, so that it is considered a line. Hence the point of relative velocity is over contact of the wheel and the surface and without relative speed, or zero instantaneous speed.

Finally, in the end of 19th century the first automobiles appeared. These were mainly motored variations from horse-carriages. It was a matter of time that these vehicles became fast enough to solid wheels present their problems. Vibrations and low friction. The transition to the pneumatic tires was slow, first appeared the solid wheel with a rubber “tire” which looks likes a rubber cap. After that the first tire appears, with air tube and diagonal plies. The evolution results in tubeless and radial ply tires. However the pneumatic tires main characteristic is that they are compliant, they deform under load, even a static one. Dynamically their deformation increase. Therefore, this results in a different contact patch relative to solid wheels (Figure 1 and 2). This is asymmetric and variable, but its size is usually the same as one hand.

Figure 2 illustrates that the contact is not a line anymore, but a contact patch which flattens when the tire is loaded and is over the surface. In this case the tire depends of the molecular interactions between the rubber and the asphalt. The contact patch and the ground develops as sliding speed which is above contact patch plane, this is called slippage. The pneumatic tire depends of the amount molecular contacts at the patch to provide a proper friction. Hence, different from solid wheels, pneumatic tire does not depend too much on the contact area, but as higher the vertical load, higher is the contact patch area and higher is the effectively contact patch area, which the one that there are the molecular interactions. Therefore the first conclusion about tire friction can be made. The tire friction is a statistical property, because it depends of several parameters which one of them is roughness. As this is better defined statistically, tire friction is a statistical property and require a proper model to be evaluated and analyzed.
Friction coefficient models
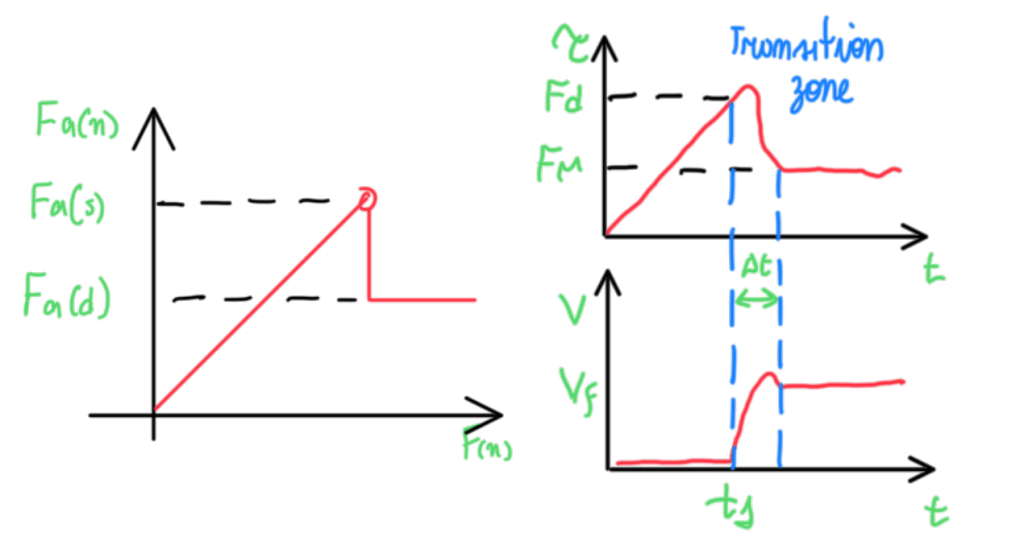
It is well known that the friction coefficient has two values, the static and the dynamic ones. Without dynamic friction coefficient there is no movement between parts or components, because there is no relative velocity between surfaces. However, the main concern is not the two values, instead it is the transition from the static to the dynamic friction coefficient and the opposite. Since friction phenomenum began to be studied, several models tried to describe this transitions. In fact, some systems develop vibrational problems due to this transition. The main model is given by:
µk = µs ∙ 1/(1-χ)
For tires the main friction coefficient values are µ = 1.00 in dry conditions and 0.80 in wet ones. Racing cars as F1 usually operates with a friction coefficients of 1.55-1.60 while GT cars usually exhibits a static friction coefficient around 1.30-1.35.

Observing how and which wheel loads iteracts with a vehicle, it is possible to define two situations, the same vehicle with and without aerodynamic devices or a shape optimized to generate aero loads (Figure 4). Supposing that this vehicle can generates two times its own weight as aero load, it is possible to understand how with the same tires and µ it is possible to obtain a higher lateral force (Fy) without penalties to the vehicle mass and dynamics. The aero load does not inflict in more vehicle weight. Hence it is possible to write:
Fz = w + A ; A ⋍ 2w → Fz = 3w
Fy = w∙ay → (w + A)∙µ = w∙ay
Fy = µ∙Fz = µ∙3w → if µ = 1 → µ∙3w = ay∙w → ay = 3
The aeroload does not represent an additional weight on the car, as it would have more material. Actually, it accounts in more load for the tire. Hence, the main point now is the transition between static to dynamic µ.
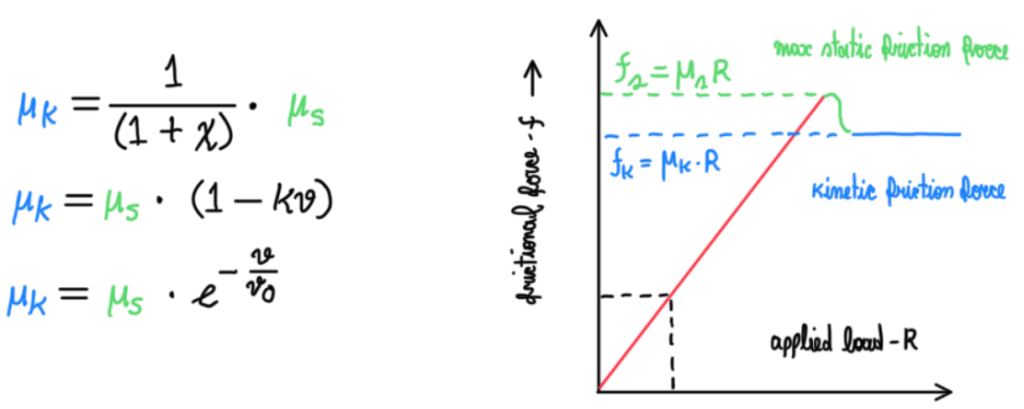
Figure 5 highlights in green the section which the transition begins, just after ther maximum static friction coefficient. This one is no dissipative, since there is no relative speed. However, in the transition zone the relative speed begins to occur, so the coefficient is becoming dissipative. The mechanisms of adhesion and cohesion appears, because tires work due to the kinect friction. In other words, tire grip is speed-related as had been noticed by the equation written in Figure 5. No matter which correlation it is adopted, most of them are experimental, but more importantly, they are all speed dependent.
Race tracks
There are several kinds of roads which cars can travel on. Their denomination comes from the past, when animals creates paths and treads. From these the road appears. The denomination pista comes from Italian “pistare” and “strada” comes from stratos, which means, layer. Obviously that during years the techniques used to built a road change, even more for race tracks. These are usually built using aggregates from crushing hard rocks of sandstones, sand and fines. Their sizes are about 5 to 10 mm. They are bonded together by bitumen. Hot-mixed with the binder results in the bituminous concrete. This is laid down on the road and compacted. There is an ideal relation between the size of the crushed hard rocks. As fine they are, they approximates to sand, in the opposite case, to rocks. These extremes are not good for grip. Hence, it is possible to observe that the development of roads depends of the kind of vehicles which will ride on it.

Since friction is property of the contact, not the tire and surface itself, the tire and the vehicle type will define the behavior of the grip curve. For instance, if the vehicle is able to develop very high speeds or if the tire will be able to develop high or lower slip angles. Hence, despite the track asphalt characteristics, the vehicle and its tires will be definitive parameters for the car behavior.
Road and race surface measurements
There are three pillars for the grip behavior, tires, cars and surfaces. These makes the measurement of the surface friction a good information for a preview of the track conditions. There are two main method to evaluate the track surface, the SRT (Rubber block) and the reference tire.
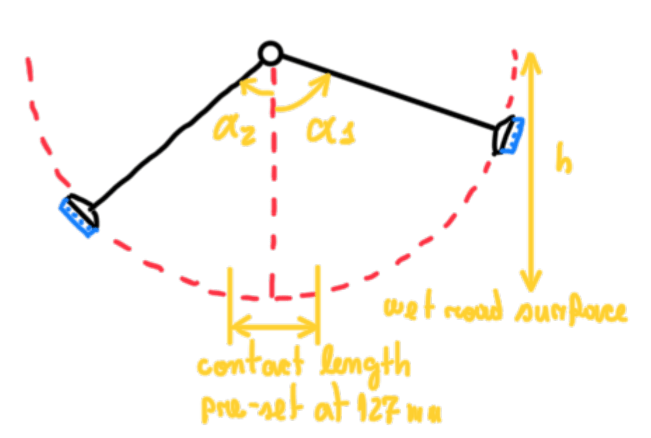
SRT is based in a pendulum which is left free to fall from a predefined height h. At the tip of the pendulum rod there is a rubber block made from a known compound. The measurement is based in the delta between the initial and final energy. This can be easily calculated since h and α1 are known. This height is usually lower than the pendulum length. In other words, the rubber block will slide over the surface dissipating some energy by friction. Hence, this can be calculated since the highest angle obtained after the contact α2 is measured. The difference between the energy after and before the friction is the energy due to friction. From other pendulum and its movement data it is possible to find the friction coefficient. This is the characterization of the rubber-wet road interface grip.

The reference tire is towed by a car that travels in a predefined speed. There are two measurements, the longitudinal friction coefficient and transversal one. The first refers to situations as driving and braking. In these cases the wheel is locked, and the friction coefficient can be calculated. For lateral loads, a slip angle is induced on the tire, thus the transversal component can be measured. Therefore, the compound, the tread height and the asphalt surface are the main parameters for the grip. Friction is a characteristic of the contact, not of the surface or the tire alone. Surfaces under friction variate their roughness over time, they becomes more and more smoother, thus the friction between tires and road surfaces reduces as tires are being used. Hence it is possible to discus about the effective contact surface.
The effective contact surface
Although it is seen that the tire is contact to the road, neither all tread area is in contact with it for several reasons. For instance, it is assumed that the road is flat, to simplify the ride dynamics calculations, but in reality what defines the contact area is the load bearing surface. This depends of the surface roughness and its voids, which defines the contact patch local pressure. The mechanisms, adhesion and cohesion, are mainly affected by the roughness, thus the load bearing surface is important for this case. If a block is pressed against a sheet of paper over a road surface it would be possible to observe some characteristics of this contact. Surfaces considered new, relatively rough, 5 to 10% of the block surface only bears on the surface irregularities.
The road surfaces
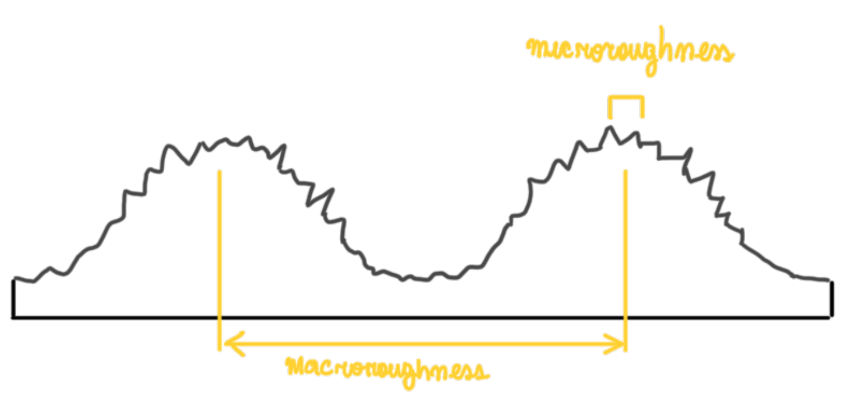
The surface roughness has two basic measures, the micro and the macro roughness (Figure 9). The first is in the order of 0.001 to 0.1 mm, while the macro roughness has the standard deviation between 0.1 and 10 mm. These also affects the friction mechanisms, which can be macromechanical and micromechanical, which refer to indentation and adhesion, respectively. In addition these mechanisms are connected to the tire rubber and polymers. For instance, in metals, the mechanism is micromechanic, because it is a different structure, a crystalline one.

Figure 10 illustrates that friction or grip is a result of the sum of two mechanism, indentation and adhesion. The grip also changes due to the temperature and the amount of rubber on the track. When rains, the water forms a layer between the road micro roughness. Hence, during wet conditions there is no adhesion, tires operation only accounts with indentation.
The adhesion mechanism is dependent of the molecular adhesion or Van-der-Waals forces between the rubber and the track, while the indentation, also called cohesion, requires bumps that penetrate into the rubber. The grip generates heat, this comes from cohesion. So this mechanism is the main source of grip. The adhesion usually contributes with 10-15% of the grip. In addition, for road cars the definition of grip is limited by safety, fuel consumption and cost.
The grip of the race tracks usually changes from one year to the next one. This suggests that roughness changes over time. In fact, it also changes over a day, because rubber is retained between the macro roughness which is an important detail about the race track roughness.

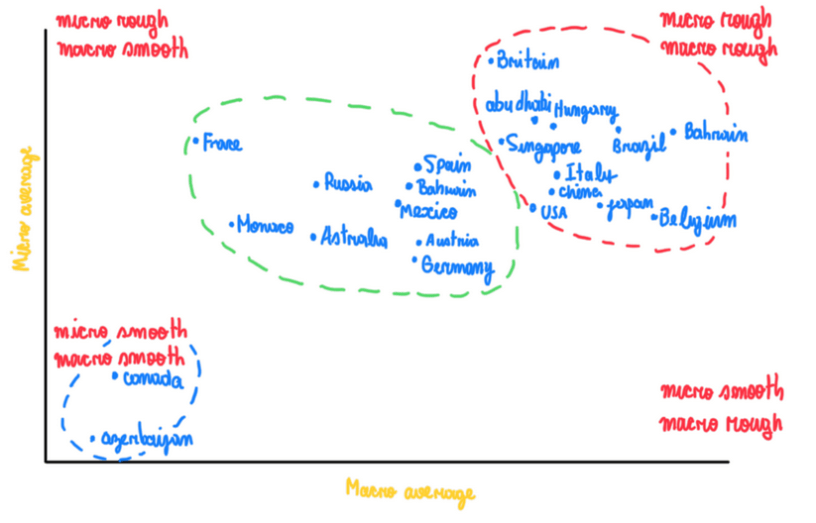
Figure 13 illustrates a graph with the compilation all the roughness data about a F1 season, it is possible to observe that any track reaches the microrough or the macro smooth conditions. Actually, the major part of the tracks are concentrated in micro and macro rough corners and in middle betweeen all conditions. This can be explained by the fact that the micro and macro rough tracks are usually circuits with a very good and new asphalt. Since this is relatively new, it exhibits a higher roughness, despite the fact the street courses or old circuits exhibit a quite worn asphalt, but not micro and macro smooth as seen in Canada and Azerbaijan. As soon a new track begin to be used, the surface roughness more and more passes from a rough to a smooth condition. Usually, street courses exhibit a more worn asphalt, because they are continually used by the urban traffic.
Grip on damp or wet conditions
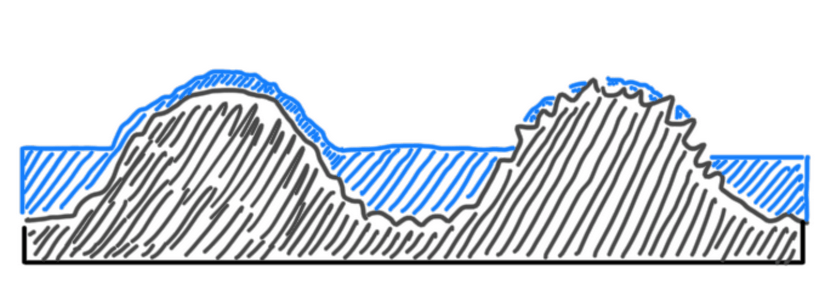
I wet conditions Figure 14, the macro roughness drains and stores water in their valleys. However, a water film is formed over the macroroughness. In the case of microroughness, this film is divided by many peaks at macro rough surface. The result is the generation of high-pressure points between the surface and the tire which goes through the water film. If the asphalt drains more water, it also provides more grip, thus more fuel consumption. This also means that this surface has a good level of micro-roughness. The wet tires on racing has much more cohesion than dry-slick tires. The loss of friction on wet/damp surfaces depends on how the surface drains water. In fact, damp/wet conditions worse the molecular or chemical adhesion while indentation does not change significantly.
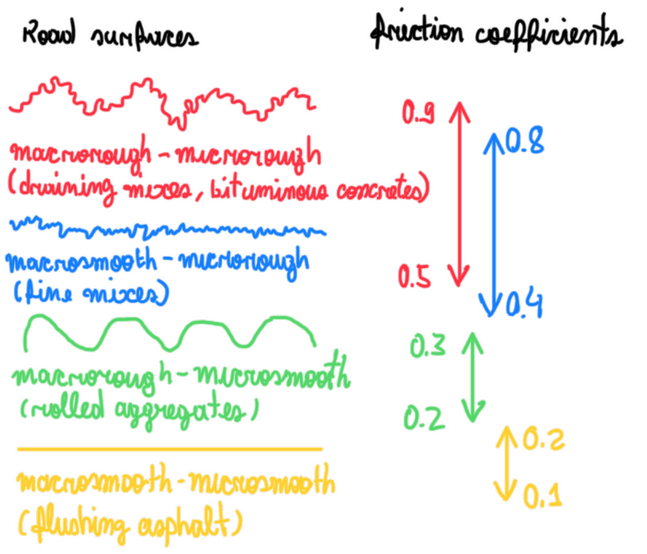
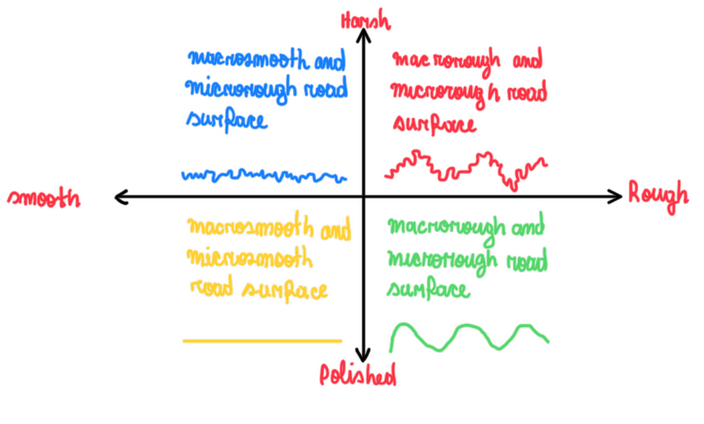
If the main types of road surfaces are analyzed relative to damp and wet conditions, macrorough – microrough is the one which is more capable to drain water efficiently. In the opposite case there is macro and micro smooth asphalt, also called flushing asphalt, with a very small friction coefficient in wet condition. This could be the case in street courses. Hence, the ideal surface is a harsh-rough one, which provides a micro and macro rough surface. The second best is the harsh-smooth one, because it still retains some adhesion and offer some dry contact.
Roughness and wavelength
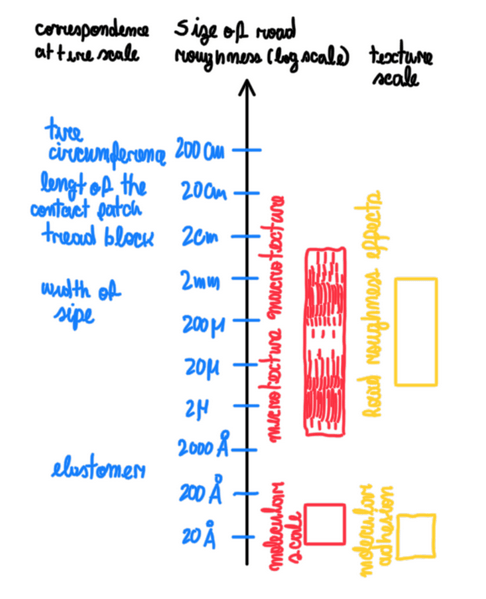
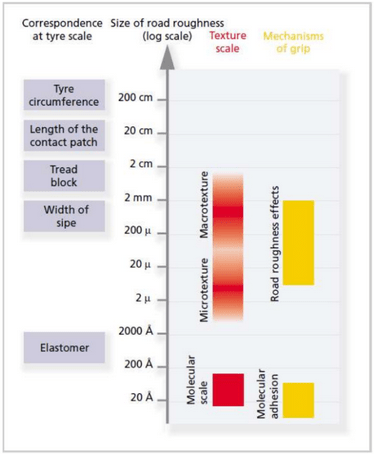
The tire friction works in a specific time and wavelength (Figure 16). The tread of the contact patch is in the order of 20 cm wavelength. The asphalt textures micro and macro vary between 10 μm and 1 mm and from 1 mm to 10 mm, respectively. The result is that each race car faces the track differently. The impact of the road on the car changes if the speed changes. Hence, the spatial frequency of the road is fixed, but the speed is what result in the variation of the time-frequency.

This is the key point, because time-frequency is related to heat. If a car run slow over a road asperities and the same car at the same road asperities is now running fast, the suspension will experience different wheel loads. The road does not change, the faster the car run over the asperities, higher the impulse. In the opposite case, the impulse is lower. Hence suspension loads are also function of traveling speed.

One of the main techniques to evaluate the roughness profile of a track is by the power spectra density of the surface (Figure 18 and 17). Usually the results of many different tracks converge to an average. As a result, all roads are similar, but they are not the same in the point of view of the car. In the racing field, this means more or less grip. Hence, the parameters that defines a road is the wave number ν and the wave length λ, which are analogous to the frequency and the time, respectively.

Roads tend to evolve their wavenumber to a lower level due to the surface polishing over time. The power spectra density is a decomposition in a series of sinusoidal functions. Hence it is possible to split the track spectra. This does not variates in time, but it variates in space, thus a road can be described by a numerical system in the spatial wave lengths.
References
- Haney, Paul. The Racing & High-Performance Tire – Using the tires to tune for grip and balance. TV Motorsports & SAE, 2003.
