Relative to tires operation there are several parameters to evaluate their performance, these are:
- Toe;
- Camber;
- Temperature;
- Inflation pressure;
- Tread thickness;
- Stagger.
Some of these can be measured and adjusted, but major of them can only be measured.
Static toe
The toe angle is a measure of the wheel inclination relative to the vertical plan which pass through the wheel center and reach the contact patch. It is seen by the top view of the car. When the plan of two wheel from the same axle are point inward, it called toe in, conversely, when it is pointing outward, it is called toe out. Usually toe is and adjusted parameter in all four wheel of a race car. The measure is millimeters (mm), but in US racing series it is common to find the unit measure “thou” from thousands.
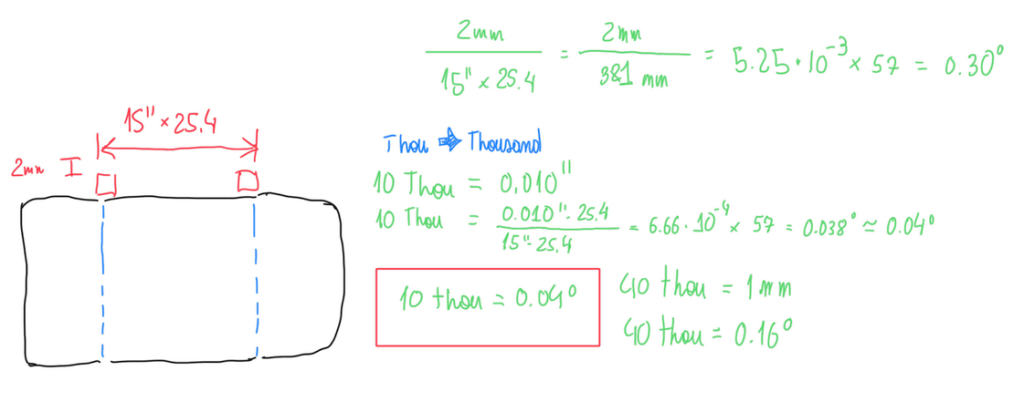
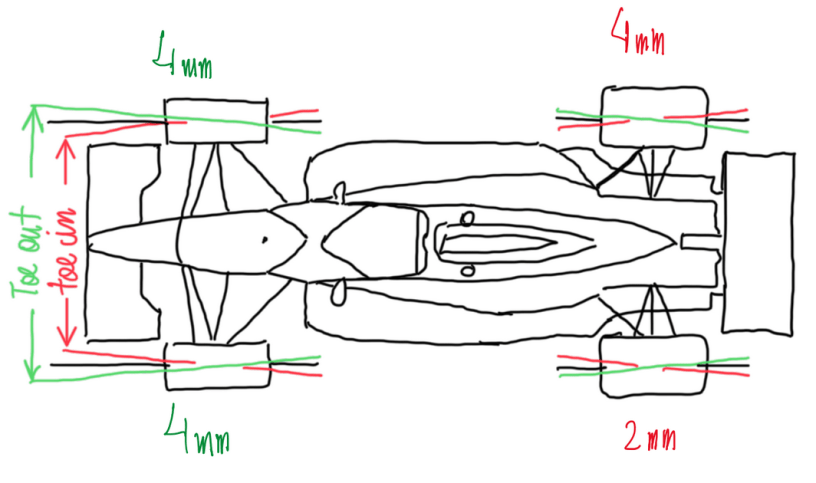
Figure 2 illustrates that 10 thou is 0.010” and the wheel analyzed has a rim of 15”. To measure the toe a spacer of 10 thou is placed on the wheel. The difference between them is converted to degrees which is the toe angle. Hence, 10 thou is converted to mm and divided by the rim diameter also in mm, the value obtained is an angle, but in radians, which must be converted to degrees. This can be done by multiplying the result by 57. Hence, 10 thou is equal to 0.04°. In addition, 10 thou is also equal 0.254 mm. Therefore 40 thou is equal to 1 mm. Figure 2 illustrates a spacer of 2 mm, which is adding 80 thou of toe, or including 0.30° of toe out. The main effect of the toe angle is the stabilization of the steering wheel. Under cornering maneuver the toe-out helps the turn-in movement and when braking it helps to bring back wheels to the straight forward position. Hence toe-out stabilize the car during braking. Conversely the toe-in motivates a fast returning of the steering, which occurs in an unstable condition. In some racing series toe is adjusted differently on each wheel depending of the track. For instance, in oval racing series, the toe adjustment is usually the following one:
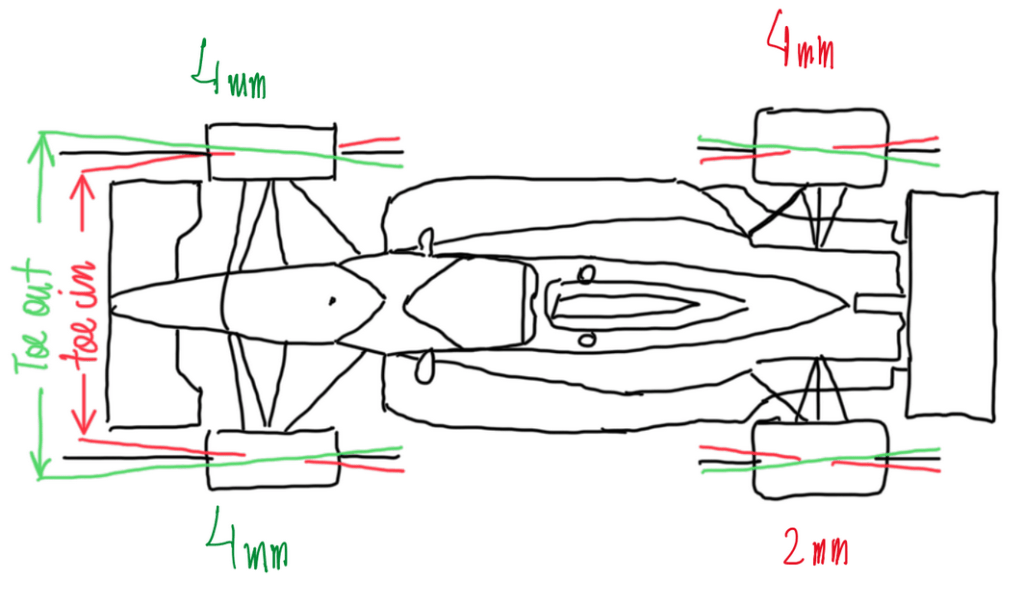
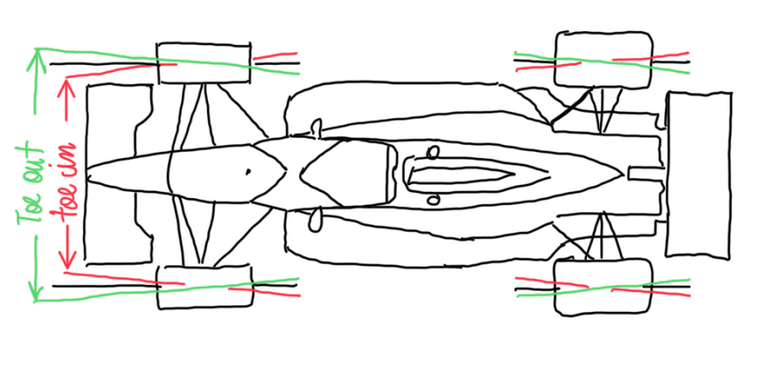
In Figure 3 the front wheels are 4 mm out while in the rear wheels have different values, 4 mm in and 2 mm out. The effects due to front wheels adjustment result in a proper turn-in, since in ovals the cars only turns to one side. In addition the steering is more stable to control. The toe-in adjusted in the right rear wheel acts to stablize the car at turn-in movement. In addition, it also provides grip at zero slip angles α. The toe-out in the left rear wheel has the same effect that in front, but for rear wheels it helps more in traction.
Static camber
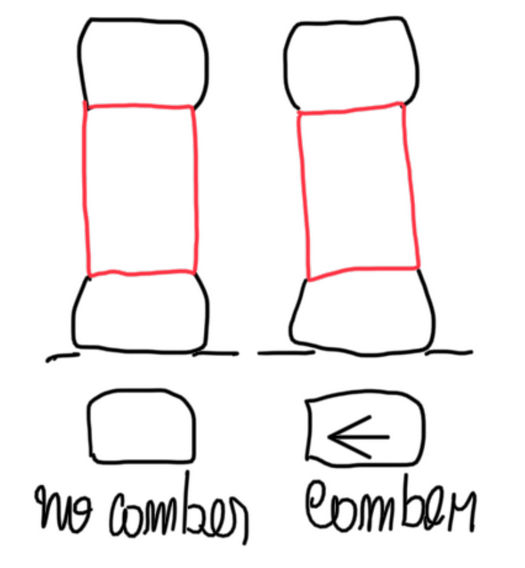
The static camber is an important tire and suspension parameter. It is the inclination of the wheel center plane relative the vertical line of the tire contact patch. Usually, in the motorsport field, the camber is measured through rim. A device is connected to the rim by three fixing points. These are enough to establish a plane, thus it will have the same inclination of the wheel center plane. In general race cars runs with a negative camber, in other words, the wheel has an inclination which the upper part of the tire points inward. In this way, the static contact patch changes, the inside part of the thread will concentrate most part of contact. As a result more wear, heat, temperature and grip are generated at that point. The reason behind the negative camber in race cars is due to the dynamic variation of it when the car is running, mainly in cornering. Due to the load transfer, the inner front wheel lose load and the camber became less negative and prone to neutral while the the outer front wheel gain load, thus its camber tend to be more negative. To avoid the neutral or the positive camber in the inner wheel, the camber is set negative. The effect of camber variation during cornering is called, camber gain. Although this is much more observed in cornering, the camber gain can occur when there is variation in the roll angle and/or vertical travel of the wheel. These two are called roll camber gain and bounce camber gain, respectively.
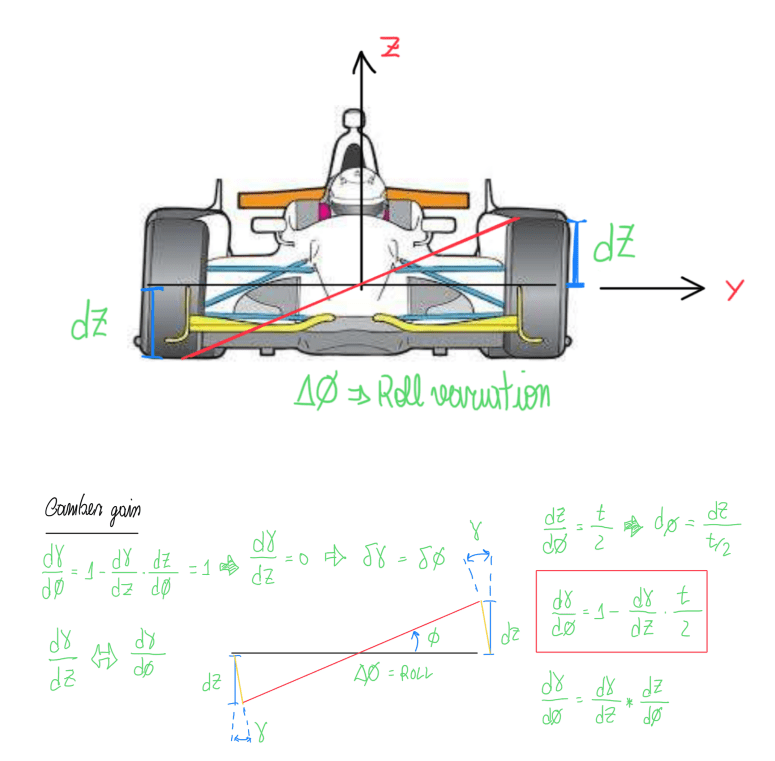
The camber gain theory begins by the roll angle variation, which usually occurs during cornering and is given by ø. Figure 5 illustrates the calculation procedure. As ø variates, the tendency is that the camber angle also variates to follow the axle rotation. However, a variation of dγ implies in dZ ones, when this does not happen it means that dø and the camber angle delta Δγ are equal. This is a very particular case which are not usually seen in racing field. Hence the correct is to consider dγ/dZ that must be found. In fact, dZ is related to the vehicle track, since ø also the slope of the axle. Hence, dZ/dø is equal to the half of the track, t/2. It is quite straightforward to find the ratio dγ/dø, since γ is the slope of dZ when the car is under a cornering maneuver. Therefore, The bounce camber gain (dZ/dø) always implies in certain amount of roll camber gain (dγ/dø). In other words, vertical displacements of the wheel results in camber variations accordingly to the vehicle track. The camber angle can be measured and adjusted, it is an important parameter for the tire performance. It usually variates according to the track layout. For instance, the camber setting for an oval track is usually similar to ones seen in Figure 6.
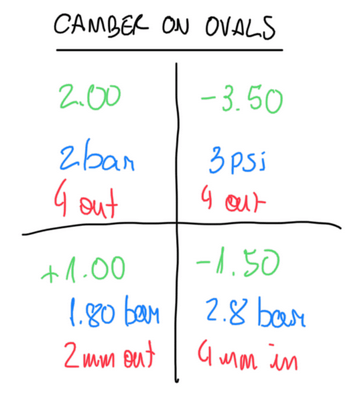
The camber angles are represented by the green numbers. In oval racing, cars only face left turns, thus the most requested tires are the one of the right side. These tire are set with negative camber angles due to camber gain effect. In the righ front wheel this effect is higher, so highest negative value observed. In right rear wheels, the value is lower, but still negative to keep the best contact patch for it during cornering, since this wheel is responsible for the car stability. The other two wheels are set with positive camber angles γ, because due to load transfer, they displace vertically. Hence, the camber gain effect occurs, but, to avoid extreme negative values, the camber is set positive and then a neutral value is obtained inside the corner. It is interesting to observe the other parameters for each wheel. The wheels of the outside (right, in ovals) are the most loaded ones, thus they have a higher pressure, 3 and 2.8 bar, front and rear, respectively. Another reason is the reduction of the contact patch length which favors the performance on the straight, reducing the rolling resistance and improving the maximum speed. For the left wheel the pressure is lower, since this considerably less loaded that the right ones. In addition, the lower pressure at front improve a bit the contact patch, which is good for corners. The camber setup for raining condition is different, higher negative values are used to reduce the contact patch and improve the tire temperature. Since the track is colder, tires lose temperature and due the water presence, they must be heated constantly. The excessive negative camber changes the contact pressure to the direction of the inner portion of the thread and reduce the contact patch length. This last point is good to avoid aquaplaning.
Pressure
The inflation pressure is one of the main parameters used for adjustment. In fact, just a pressure increasing results in more temperature, more heat and less tread area. This parameter is complex to adjust, because it changes according to several other important parameters. During racing the inflation pressure is measured by sensors on the tire pressure valves. This sensor also measures the temperature. However, the temperature gain during operation occurs by the tread. As the tire is being used, the tread heats up and, through conduction, it transfers the energy to the side walls from these to the rims. These are not only responsible for side wall support, as also to heats up the inflation air. When this becomes hotter, the pressure increases and deforms the thread. This one became smaller and prone to an overheating condition. Hence the tendency is the grip reduction.
The variation of the inflation pressure
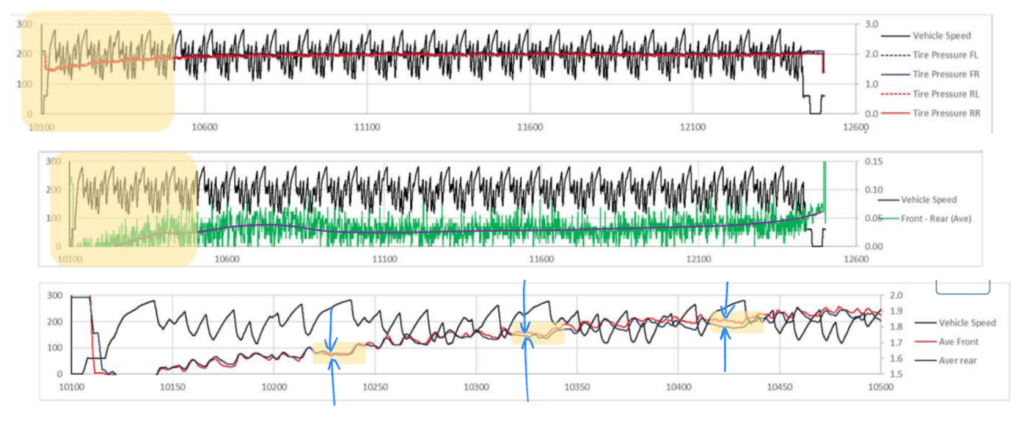
Figure 7 illustrates an outing of three laps and also how the tire pressure variate along the track and laps. This variation is due to the alternations of the load transfer during the consecutive cycles of re-acceleration, braking and cornering. By Figure 7 it is also possible to visualize the difference between the pressure evolution during the outing. In the first lap the front and rear tire pressure are practically equal. However, after the second lap it is possible to notice the increase on the average front pressure relative to the average rear ones. This is clear in the third lap, which is clear the gap between average pressure in the front and rear tire pressures. The gap may is a clue of some situations. First, the car may have a setup which is too understeering, which makes the front tires have an exagerated increase in the temperature, the pressure and the wear, thus a reduction of the contact patch. In the end of the outing it is possible to visualize a strange temperature peak. This occurs due to the heat soak. Although the tires are constantly being stimulated to gain heat, there is just an increase pressure while in temperature this is not seen. Instead constant cycles of increasing and decreasing suggest that pressure and temperature variation reach a steady-state process. However, what really occurs is the reduction of the tread thickness. The tread is responsible for the tire grip and the flash temperature. As the tread slides over the road, the friction and the slip angle α generates heat, temperature and grip. This heat is transferred to the sidewalls and to the rim. This is heated up and transfer its heat to the inflation air inside the tire. The air becomes hotter and expands, this deformation stresses the sidewalls and reduce the contact patch. This helps to increase the temperature at the contact patch. As the tread is being consumed, less and less rubber is on the tread and thus less means to exchang heat to the inflation air. Therefore the tire starts to cool and lose grip.
Cornering stiffness and lateral friction coefficient (C anb μlat)
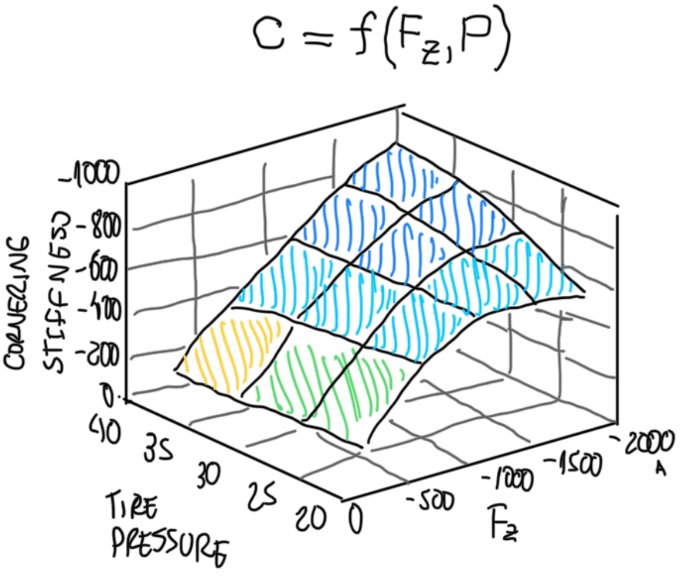
As the tire performance depends of the pressure, it is possible to evaluate how this parameter results in variations of the tire performance. Two parameters are mainly correlated, the cornering stiffness (C) and the lateral friction coefficient (μlat). In fact these are a kind of overview of how capable a tire to provide grip in a cornering situation. The first, cornering stiffness is correlated with the vertical force (Fz) and tire pressure (P). As can be observed on Figure 8, the correlation of P and C can not be defined alone, it must be done also verifying the effects of Fz. Hence it can be established that when Fz is low, the effect of P in C is almost insignificant. This situation is usually seen in maneuvers at very low speed, as in parking lots. These are characterized by very small slip angle α or null ones. However, as the maneuver is being performed at a higher speed, Fz naturally increases. At this situation the effect of P is clear. As P increases, C also increases. This means high speed corners, line change maneuvers and slalon tests. These movement are characterized by a significative value of α. The effect on the vehicle is, as P increases at high Fz maneuvers, C tends to increase. At same Fz, but with lower P, C decreases. This means that α are required to produce grip. Hence, lowering P increases temperature, hysteresis, grip, but also increases the thread wear and the drivers effort on the steering wheel.
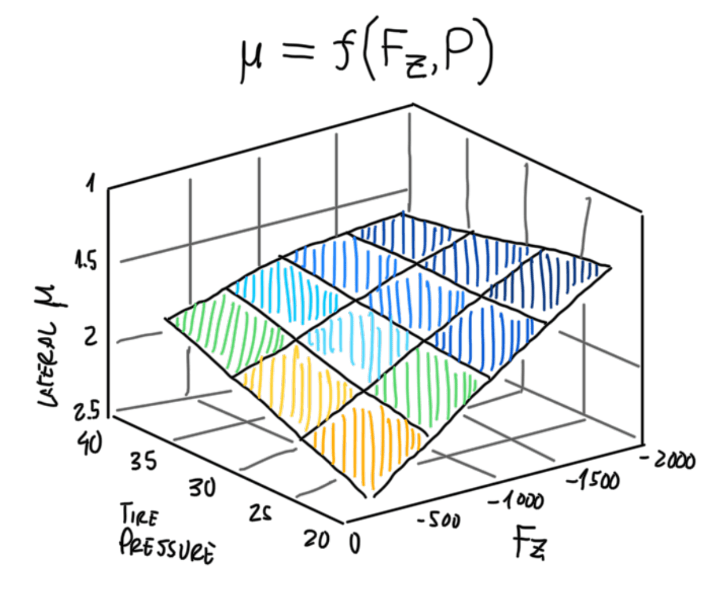
When the same is anaylized in the point of view of the lateral friction coefficient (μlat) the graph is more linear (Figure 9). In fact, C(Fz,P) is a monotomic function. Hence, P also behave differently when Fz variates. With lower loads, P correlates linearly with μlat. Hence, this suggest that at low speed maneuvers a high tire pressure is interesting. However, as Fz increases, the μlat correlation with P reduces its slope. At a very high Fz, P correlates inversely with Fz. This occurs because of the contact patch variation under Fz. For low Fz, P can be increased to provide more heat in the contact patch and thus, grip. When the maneuver occurs at higher speed, P should be lower, because a higher pressure reduces the contact patch, overheats it and loses grip. Thus a lower pressure results in more compliance of the tread, more slip angles α, more heat and grip.
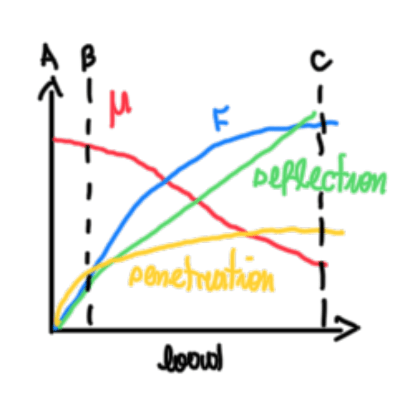
Figure 10 illustrates how μ, lateral F, tire deflection and penetration correlates which Fz. The main points at Figure 10 are penetration and deflection. The first exhibits a non-linear increase with Fz. This is the tire friction mechanism called indentation, which provides the biggest part of the grip. Deflection is the tread variation along the load increase. A linear increase can be observed, which suggests that at high lateral F the sidewalls exhibits a great distortion, and indirectly, more slip angles. However it is interesting to observe that as Fz increases, the friction coefficient reduces. This suggests that at some point the tire loses its elastic behavior when enter in the transitional zone. At this point the friction coefficient μ begins to reduce. The slip angle α became excessive and the tire finally reach the frictional zone, which the tire loses grip, thus lateral force F.
Temperature
There are some temperatures relative to tires, these are:
- Flash temperature;
- Tread temperature;
- Bulk temperature.
The first is the one at the thread during operation, the tread temperature is the one measured when the car enters in the pit-box. The last one is the bulk temperature, or inflation air temperature. A race tire operates heating the tread that by conduction heats up the side walls. By these ones the rim is heated, thus it transfers heat to the inflation air. The tread temperature does not define the bulk one, rather it defines at which rate the tire reach the working temperature, in other words, grip. The importance of the bulk temperature is the air expansion inside the tire inner liner. This results in the distortion of the tread, that reduces the contact and improve the heating process. The temperature measure is so critical, that race teams usually have procedures to perform it. The first tire to be measured is the most requested one. Considering an anti-clockwise course, the front right side tire is the first to be measured, thus the sequence is right rear, left rear, left front and right front again, to measure the temperature reduction.
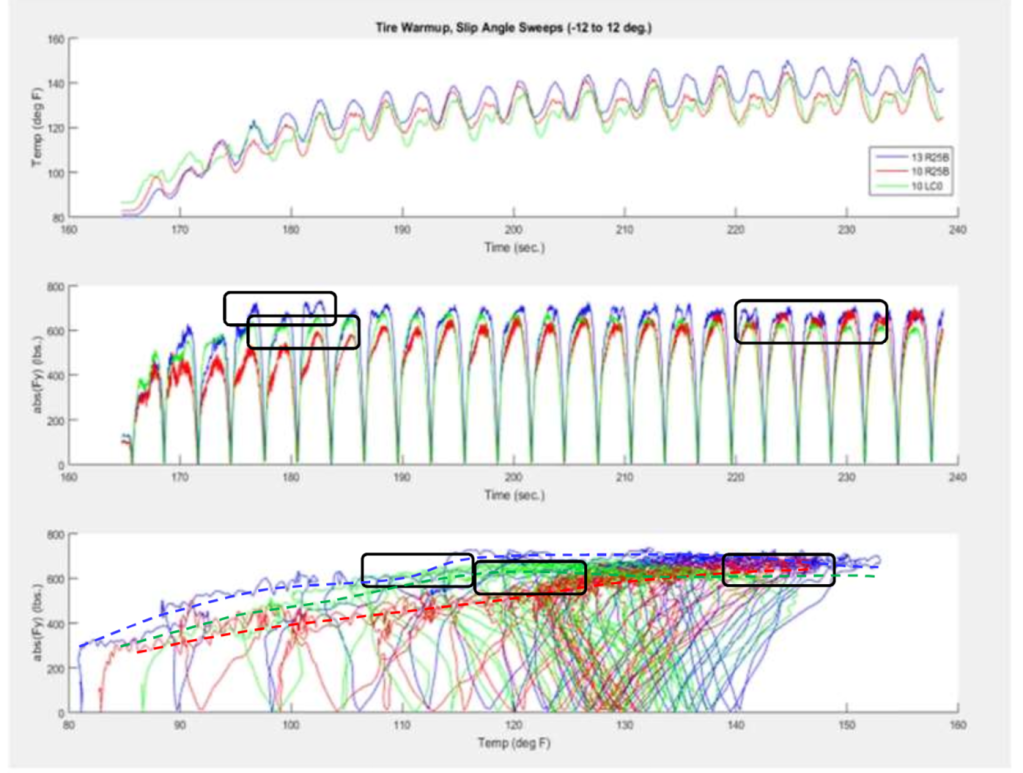
Figure 11 illustrates the screen of a data acquisition system about the tread temperature evolution during an outing. As can be seen, the blue line describes a tire that is faster to heat up and is able to operate at the same grip level. The green line describes a tire that heats up faster than the one represented by the blue line. However, it exhibited a decrease in the grip at the end of the test. The tire described by the red line builds grip and temperature more progressively, but generates the same grip as the tire of the blue line. Finally, it is possible to conclude, just visualizing the variation on the tread temperature that the blue line tire is more sensitive to heat variations, the other two are more gentle and bring grip more slowly.
Tread thickness
The tire tread volume is a deposite of chemical energy. However, as the tread wears, this energy reduces. Hence the measure of the tread depth is, at some degree, the measure of available energy inside the tire. A clue that indicates that the tread is being consumed is the tire temperature. Since the tread is heated due to friction with the asphalt, until the point that the temperature generated is low, the tire still has rubber to be consumed. It is important to account that the aerodynamics has a important effect in tread temperature. For instance, a race car setted to develop excessively high downforce will provide grip at very low slip angles. As a result the tread will no heat as properly and this can not be confused with low tread temperature due to a worn tire.
Stagger
In some racing series the tires used in the rear axle have different diameters. This is called stagger and became an adjustment parameter in racing series as Indycar, Nascar and Sprint Cars. The objective is provide an effect of differential to helps in oval tracks, since the car only turns to one side and uses a blocked differential. Tire manufacturers provide different types of staggered tires. In addition, there is a tape used to measure the tire circunference and evaluate the cold and hot stagger, which refers the tire temperaure. Since a hot tire will distorts the tread it is possible to create a stagger effect just inflating the tire with a very high pressure.
Tire pressure and temperature examples
To better understand the effects of inflation pressure and temperature on tires, two examples are proposed. Observations about the temperatures measured are made according to the situation. Figure 12 illustrates the first one.
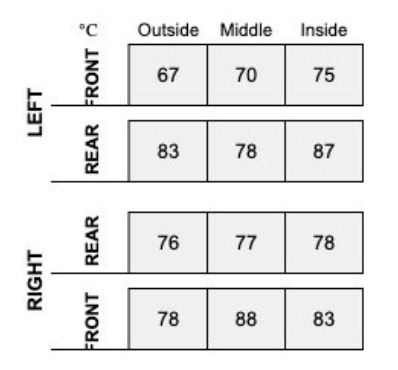
Tire temperatures are measured during a pit-stop, according to Figure 12 it is possible to make the following observations about front left tire (FL):
- Out of window;
- Temperature spread indicates too much camber, 8° instead of 5°;
- Underpressured tire
The front right tire (FR):
- Inside window;
- Temperature spread ok
- Overpressured tire.
The left rear tire (LR):
- Inside window;
- Temperature spread ok;
- Underpressured tire.
The right rear tire (RR):
- Inside window;
- Pressure ok.
The proposed action are to reduce FL camber and FR tire pressure and increase RL tire pressure. The values exhibited in Figure 12 indicate a delta between the front and the rear averages, which are 76.84° and 79.84°, equal to 3°. This value is inside the target proposed. However, as the front axle has a lower average temperature than the rear axle, it is reasonable to conclude that this car has a slight understeer behavior. Figure 13 illustrates the next example.
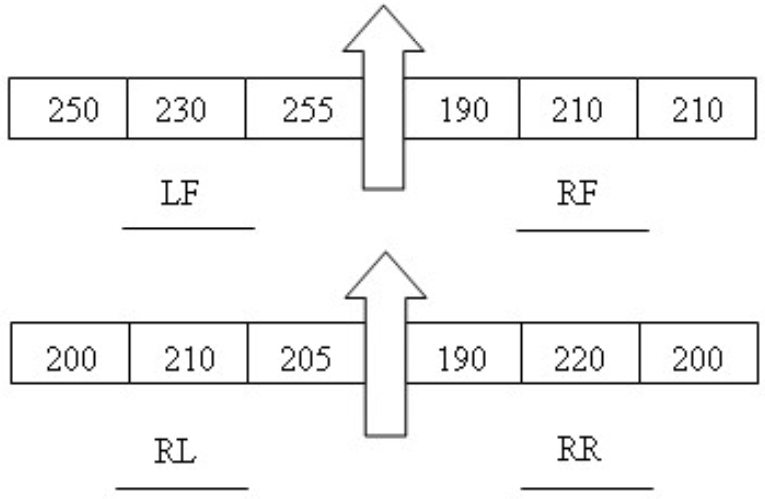
The following comments can be made about the front left tire:
- Out of window;
- Delta ok.
The right front tire:
- Out of window;
- Delta not ok, too little camber.
The left rear tire:
- Inside window;
- Delta ok.
The right rear tire:
- Out of window;
- Delta ok.
According to the observations above it is proposed to increase LF tire pressure, to increase RF tire camber, to decrease RR tire pressure and to decrease LR tire pressure. In addition, LF tire exhibited a drastically higher temperature relative to all the other tires. This is an indication of too high vertical load over the tire. Hence, it is advisable to review the setup. The balance temperature between the axles indicates an oversteering behavior. However, after the adjustments on FL tire, the car behavior may change.
References
- Haney, Paul. The Racing & High-Performance Tire – Using the Tires to Tune for Grip & Balance. TV Motorsports, SAE, January, 2003;
- Balance Motorsport Website;
- Your data driver website.
