
The tire operation is much more than just put it over the ground, load it and then apply a torque. As soon the tire is loaded, it deforms the contact patch. When the steering wheel is rotated, front tires develop a slip angle α, thus lateral forces Fy are generated and the vehicle yaws. Since rear tires are fixed, they resist to the yaw, produces its own slip angle αr, then their lateral force Fy2. Therefore, there are many parameters that affects tire operation. This article proposes an overview of the components that allows tire to rotate producing lateral and logintudinal forces.
Lateral force x slip angle
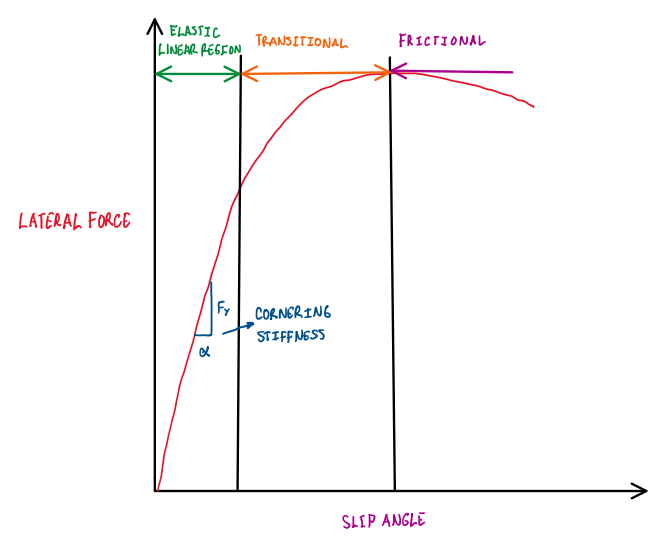
Figure 1 illustrates the correlation between Fy and α. This is a generic graph, because each tire has different characteristics, but the overall shape of the curve is similar. Hence, this is a result of the cord angles and rubber compound used in the tire structure, sidewalls and tread. The curve has three different phase, the elastic, the transitional and the frictional. The elastic phase is also called linear, because the tire operates with a linear proportion between Fy and α. This phase usually depends of the tire stiffness, but it is also connected to the weight distribution. If α is further increased, the tire enter in the transition phase, which is characterized by lost of the proportion between α and Fy. Now an increment of α results in lower increments of Fy. When Fy reaches its peak, the tire is now at the frictional phase. This is characterized by the collapse of the lateral force. Its decrement can reach 30% in some cases. At the frictional phase the tire is almost at complete sliding and generates more heat and wear.
Longitudinal force

Figure 2 illustrates the most important point for the longitudinal force Fx, this variates if the condition are driving or braking. Actually, when driving, wheels try to rotate at a higher speed than the grip allows. On the other hand, braking maneuver tends to have wheel lock due to the excessive wheel speed reduction. However, it is possible to observe that Fx variation is different. For instance, in driving, the force peaks very fast, but also decay rapidly. At 50% slipping force is already 25% lower. In braking the peak force is also reached fast and the decay starts at 25% slip, but it occurs progressively. There is no such explanation for these differences. Since these graphs are describing road tires, the behavior of race tire should be different due to the better structure and rubber.
Combined forces

The important point about combined forces is that as soon the slip ratio increases, the tire capability to produce grip reduces. Figure 3 illustrates general graphs, but it is well known in this area that these kind of data are restricted to tire manufacturers.
Friction circle

The friction circle helps to understand how tires generate different forces at pure longitudinal, pure lateral and combined forces. It is not possible to generate the maximum lateral force when the car is driving or braking, because if this happens it exceeds the tire boundaries, which is the tire grip capability. Actually, the friction circle usually is an ellipsis, because in braking there is some additional contribution of the aerodynamic, specially drag.
Lateral deformation of the contact patch
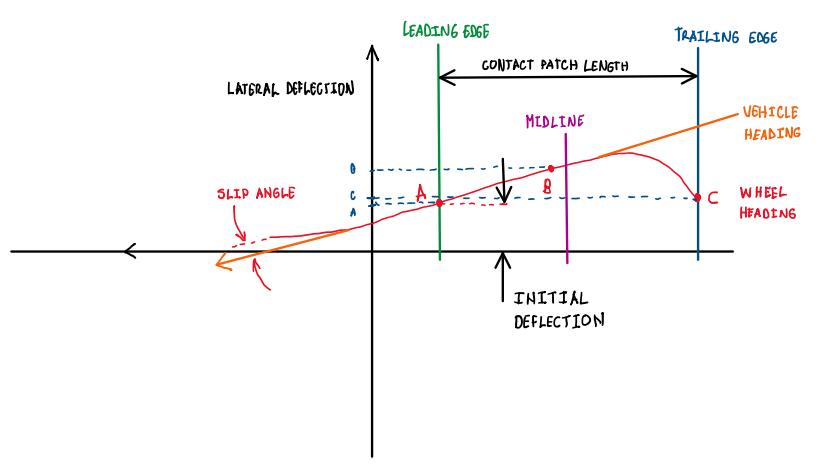
Figure 5 describes the lateral deformation of the tread, that at some point it is distorted due to the same wheel steer angle δ. The orange line is the vehicle heading, which is the line of the zero deformation. This line makes an angle with the red curved line, which is the slip angle α. If a single point on the tread surface is followed, it is possible to observe how the lateral deformation is developed. At point A, the lateral deformation is already started, but it still is at the linear range. The only difference is that when a portion of the tread reaches the point A, it is at the leading edge of the contact path. Although the belt and the tread are made from stiff materials, they allow some degrees of compliance. For this reason, some portion of the tread is already distorted before the contact with the ground due to the effect of the weight and wheel loads. When the section under observation is going to the point B, the tread still is adhered to the asphalt, thus the deformation still occurs linearly. At point B the tread begins to slide, because the force required to deflect the tread exceeds the local friction coefficient times the wheel load (static plus dynamic one). Finally, at point C, the portion under observation rotates out of the contact patch following the wheel heading. Although the distortion is reduced, there is still some deformation, which results in α, thus generating Fy.
Tire width importance
Tire have a complex contact patch, different from rigid wheels, a pneumatic tire has a contact patch defined by internal pressure (IP) and wheel load. When IP is low, the contact patch area increases and the tire tends to improve grip. Wheel load increments also increase grip, but at a small increments relative to what was added. Hence, a better improvements can be the tire width increasing. Supposing two tires exposed to the same loads, one has a higher width relative to the other. It is important to understand, that a wider tire has different effect relative to IP reduction, this one also increase the contact patch, but longitudinally. Defined this, it is possible to approach the concept of a shorter contact patch. A shorter contact patch exposed to the same slip angle begins to slip at almost the same distance from the leading edge than a longer one. Hence, no significative difference between a tire with low and high IP, in this case. The point is, with a shorter contact patch, more portions of its length is really stuck on the road and this is only obtained with wider tire. Even though a narrow tire has its IP lowered to equal conditions, the contact patch will became longer than wider, this does not succeed in obtain more points sticking the road, actually there is less. Therefore, for the same vertical Fz and α, a wider tire is always better.
Self-aligning torque

Figure 6 illustrates how the self-aligning torque develops along the contact patch. Fy varies along the contact patch and the distance from the resultant lateral force to the midline defines how big will be the self-aligning torque. The lateral force begins to increase at the leading edge of the contact patch, reaches its peak, then due to the tread sliding it begins to decrease. After the point of peak of lateral load, the tread structure progressively overcome the tread grip on the road and the lateral load goes back to zero.

Figure 7 illustrates two schematics of the same tire performing a corner, thus developing a α and then a lateral load Flat. This is not generated at the center of the contact patch due to the tire deformation at the region in contact with the ground and the one at the vicinity of the contact patch. Hence, Flat is produced at a distance T from the contact patch center. An approach to simplify this schematic is displacing Flat to the center of the contact patch, but including a moment, which is the self-aligning torque. Actually, this is Flat times the pneumatic trail T. Therefore, with right-side schematic it is possible to describes what the driver feels during steering, the lateral force Fy and the self-aligning torque.

The correlation between self-aligning torque (SAT), vertical load (Fz) and α is illustrated at Figure 8. It is possible to visualize that SAT peaks at small α. In addition, as the slip angle increases, SAT decreases until reach very small values. The Fz increasing shows that the peak of SAT follows, thus it is required a careful analysis of the wheel loads, because the driver must be able to steer the car. Hence, race cars with massive aerodynamic loads are critical, since to go as fast as possible, the driver should be able to control the car at high downforce corners.
Vertical forces in the contact patch
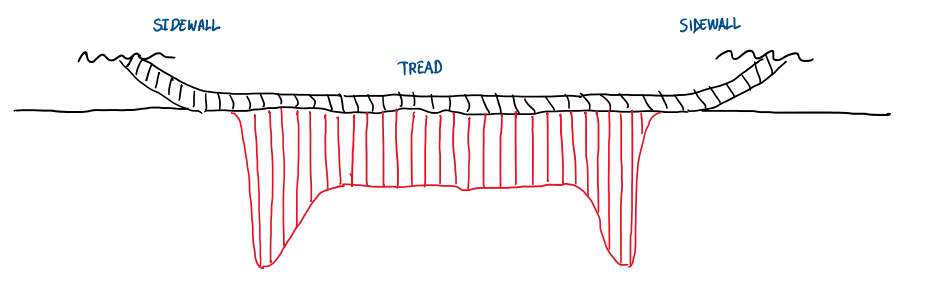
Figure 9 illustrates what happens with a tire when it is on the ground, ready to work. There are two zones of peak of contact pressure. This
occurs due to the tread and sidewall bending stiffness. It increases the contact pressure at the leading edge.

As can be seen on Figure 10, Fz increases to its peak as soon the tread enter in contact with the ground. There is a slight reduction of Fz during the contact, then tread finally gets out of the ground, or rather, a section of the tread. The fast increase of Fz occurs due to a kind of distortion that each section previous to enter in contact with the ground gives on it. This is called tread momentum and is influenced by tread and sidewall stiffnesses. Although Fz peaks very fast, the same does not occurs to Fy. Actually, it develops progressively and reaches its peak near to the trailing edge, more precisely, at a distance T from the contact patch center which is referred as midline. This is called, pneumatic trail. The tread momentum is an effect that is created due to the difference between the loaded radius (r0) and the free radius of the wheel (r). This results in a vertical velocity component of the tread as it rotates into the contact patch. However, once at the contact patch the velocity is slowed down that results in the tread pushing on the road at the leading edge. This pushing force decreases alongs the contact patch, but its effect becomes stronger as the speed increases. Hence, there are cases that tread momentum literally affects the vehicle ride height (RH) and the tire spring rate. This must be accounted in high downforce racing car design. Another observed tread momentum effect occurs in top fuel drag cars, which allows big longitudinal forces at the start and high speed without gear change, since tread momentum is so intense that affects wheel diameter and gear ratio.
Rolling resistance
The rolling resistance of at tire is a natural effect of the rubber, the hysteresis. However, parameters like temperature, internal pressure (IP) and speed can worst the situation. The hysteresis is basically the energy absorption during rubber deformation, since it never returns to its original condition without some heat generation. Hence, some resistance to rotate is expected. IP and temperature can change this situation. Actually, IP and Fz define the contact patch shape and area. If Fz is increased while IP is hold constant, the result is a longer contact patch, more hysteresis and high temperature at the tread. However, the longer contact patch results in more rolling resistance. An interesting effect is observed if Fz is kept contact and IP is increased. The result is the shortening of the contact patch length, thus less loses due to hysteresis and lower rolling resistance. Actually, these cases describe the basic effect of a tire with low and high IP, respectively. The rolling resistance reduction always comes at cost of some grip. However, the rolling resistance is also a function of speed. As this increases, the rolling resistance also increases, but the energy absorption of tire makes it hotter. This energy is transferred to the inflation air through the rim. Hence, the air expands, stretches the tire tread which became more flat. The result is the reduction of the rubber hysteresis, because this is reduced by the higher temperature. Therefore, the increase of the rolling resistance with speed results in two positive consequences, a stable contact area and the runaway failure mode at high speed.
Tire induced drag
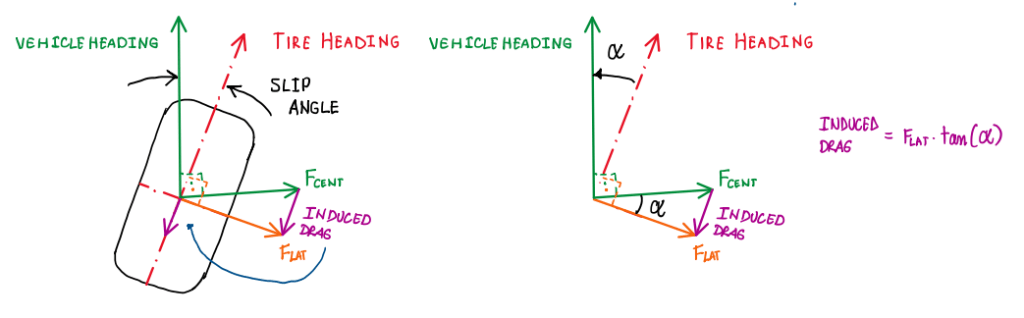
As can be seen on Figure 11, the induced drag is a consequence of α developed by the tire when it is steered. Since the vehicle has a centripetal force (Fcet) component perpendicular to the car, Flat component biased at an angle α from Fcent generates the induced drag. This name is given due to the similarity with the aerodynamic lift and the angle of attack. However, induced drag is a kind of rolling resistance that only comes to play when the tire develops the slip angle.
Camber thrust

The camber adjustment in race cars usually is defined by negative angles. In other words, the top of the wheel is point inwards, which means that both tires of the same axle are getting closer at their tops. The result on the contact patch is that there are more load on one corner of the tire. Hence, the contact admits a trapezoidal shape which causes a small slip angle even when the wheel is rotating with no steering. Hence, the other sections of the tread follows this slip angle as soon they enter in the contact with the ground. As a result, a small lateral force is developed at zero steering angle. The good point of this effect is that this lateral force comes without any significant increase of the tire temperature.
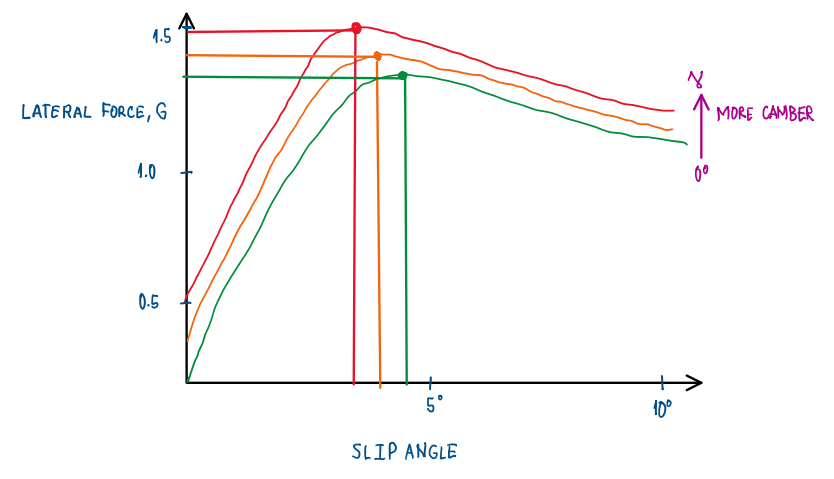
Figure 13 illustrates that the camber angle γ can result in higher lateral G and with this coming at slightly lower α.
Inflation pressure (IP)
Haney P. Defines tires as a kind of spring, but their spring rate is mostly characterized as the inflation pressure. When tire pressure is
mentioned, it is implicit its correlation with temperature. This occurs, because the air inside tire is heated by its rim as tire is being used.
For this reason, cold pressure setup is an extremely important setup parameter, it defines if the tire temperature is inside or outside the
working temperature window.
Tire standing waves
Another consequence of the contact patch deflection is called standing waves. When a section of a rotating tire is getting closer to the contact patch, that section of the tread begins to distort. It reaches its full deflection along the contact patch, then begins to be released near to the trailing edge of the contact patch length. At this point, the distortion propagates to the unloaded portion of the tire and during high speed condition, this generates waves that goes over the unloaded tire tread, but it is damped before reach again the leading edge of the contact patch length. Although modern tires deal well with standing waves, these are another source of heat and stress.
Vertical load sensitivity

Although Figure 14 can help to explain the tire grip sensitivity to Fz, there are many factors that affect this. Hence, it can be accounted the tire temperature, tread and sidewall stiffnesses, sliding speed and surface roughness. However, what really comes first are internal pressure and contact patch. IP is defined according to the loads, more load, more IP. When Fz increases and IP is the same, occurs a variation of the contact patch length. It becomes longer. Even though the contact patch area increases, there are more points of the tread sliding instead of sticking on the ground. As a result, the Fz increments are not fully converted into Fy, and when they are, the proportion of the gained Fy decreases as Fz increases.
References
- Haney, Paul. The Racing & High-Performance Tire – Using the Tires to Tune for Grip & Balance. TV Motorsports, SAE, January, 2003.
