The fifth part of the math channels review deals with the main ones used to describe the vehicle behavior. In addition, the most complex case is also discussed, the transients. At the end, it is reviewed the main forms to built the statistics of the math channels. This allows to build balance score cards in order to evaluate the driver, the car and the team.
Understeer – Oversteer (USOS)
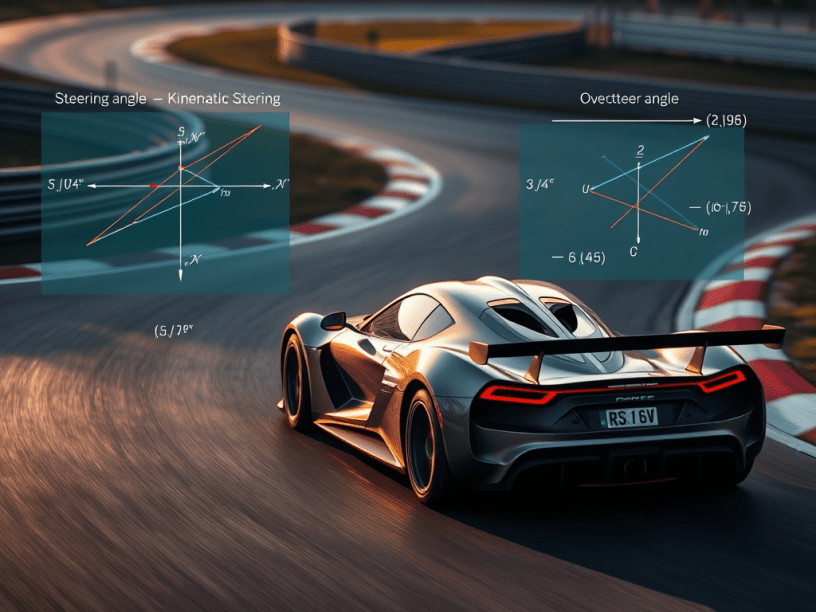
The calculation of the understeer-oversteer math channel and related parameters are exhibited in Figure £. The steering angle is the one at the steering wheel divided by the steering ratio. Then, it is possible to calculate the kinematic steering, which is the steering channel inside a conditional logic. In this case, if the radius is less than 300 m, the kinematic steering will be the wheelbase divided by radius times the conversion factor. The radius can be positive or negative. For instance, in a given corner radius the situation is the following. The steering angle is 5° and – 5° divided by the steering ratio. Then the kinematic steering is 3° and – 3°, thus USOS is 2° and – 2° since it is the difference between the previous two parameters.
| side/parameter | δ | δ0 | USOS |
| Right hand | 5° | 3° | 2° |
| Left hand | – 5° | – 3° | – 2° |
These two values represent the same amount of understeer, they are multiplied by the sign of the lateral acceleration. After that, it is multiplied by the modulus of the lateral acceleration if this one is meaningful. In the case under example, it is 0.5 G. This is a way to exhibit the understeer only at a specific kind of corners. In Figure 1 it is possible to visualize in two situation in the beginning of the outing. The first is the negative steering and kinematics and the positive understeering, because it is counted the difference changing the sign. Hence, there are events that exhibit understeer and the ones that exhibit oversteer. Usually, this last condition is common at the corner exit and reflects the inability to reach full throttle at high speed. The throttle is the primary handling control. It is faster than the steering, thus this one comes later for a given throttle position. If the driver is to early on throttle, the amount of oversteer is too much and this inability to reach full throttle is evident on the oversteer. There is a maximum level of oversteer that the driver can cope. The driver and the car are not separated, they are one system. There is no issue which separately addressed to the car and the driver, they are issued together. In endurance racing two are compared with the same car. The complaints are different, but the car and the setup are the same.
Figure £ illustrates a plot of the understeer channel along an outing. It is possible to notice that there are understeer and others there are oversteer. In this case, it is possible to built math channels to count the cumulative of these two events. The logic channel is built to describe if the understeer channel (USOS) is indicating understeering or oversteering behavior. Hence, as seen in Figure £, the sign of USOS is multiplied by the conditional of the lateral acceleration. If this is higher than 0.5 G, the logic return 1, or rather 0. The blue line is respective to USOS if understeering, while the red line is USOS if oversteering. Then, it is possible to plot them together with the logic. This describes understeering, neutral and oversteering as 1, 0 and – 1, respectively. Although it looks like understeering and oversteering are occurring at same time, this is just due to the plot zoom. Since this logic counts those events, it is possible to perform the cumulative of this parameter.
Figure 3 illustrates the cumulative of the understeering and the oversteering channels. However, the sum is performed not on the unitary value of the logic, instead it is over the values of USOS. For this reason the cumulative for understeering increases its value, while the same for oversteering, decreases. Hence, the value of this channel is adding increments of understeering or oversteering separately, thus its unit is degree (°) or radians (rad). In the case of Figure 3, it is possible to visualize that there is a situation which understeering and oversteering occurs with a higher intensity with respect to the other events. Then, verifying this graph together with a split chart, it is possible to evaluate this situation. Hence, if it is necessary to make a setup correction, the first one would be related to that corner. The reason is that in this one, the car exhibits a severe understeer at mid corner and oversteer at corner exit.
A common doubt in this case is which one should be corrected first. The approach should consider what occurs first. A severe oversteer is consequence of a severe understeer at mid corner. In this situation, the driver has to turn much more. Meanwhile the speed and the grip demand goes down. Hence, when the front tires finally recovers grip, the car end up with too much steering, thus it oversteers.
The level of the understeer and the oversteer events can be evaluated. This is done by calculating the USOS channel as a function of the turn radius, thus based on this, it is possible to predict the level of USOS. It is accepted more understeer in tight corners and more oversteer in high speed corners. The cumulative parameter can be done for almost all parameters. At the end of a lap, the cumulative channel illustrates the total understeer in a lap. The same can be done for the oversteer. Hence, the right question for the data is how much understeer and oversteer events, because both occur. Assuming a terminal value for understeer and oversteer, it is interesting to evaluate the end of lap values.
Figure 4 illustrates the end of lap cumulative for different setups. Between configurations 1 and 2 it is possible to notice an increase and decrease on the understeer and the oversteer, respectively, in the same amount. This is a clear setup change that shifted the balance of the car towards the rear axle, the understeer occurs in a proportional way. The important point is for the engineer to tune the car in order to locally solve a problem. Hence, the car should be changed were it is requested. For instance, wings are effective on high speeds, thus there is no reason to change them in medium and low speed section. Anti-roll bars are good for low speed maneuvers. The good engineer knows where to change a setup once it sees the issue on the data. The setup 3 holds the same cumulative for oversteering, but the one from understeering is reduced. This decreasing continues in the setup 4, while the oversteering is kept the same. The setup 5 holds the understeer at the same values and neutralizes completely the oversteer. With some practices and experience, it is possible to know the amount of what does what. Then, with the complete dataset of the setup changes, a sensibility of those modifications.
Transients
If it is possible to estimate the side slip angle (β), the slip angles (α) can be calculated. Hence β is zero at the corner entering and exiting, it is a variable through the corner and it becomes the side slip angle at the steady-state βss. Therefore, β changes, in transient β’ and becomes zero. In terms of math channels, it is possible to build one for β, thus slip angles (α) can be defined. If the yaw rate (ψ’) is measured, it is possible to calculate (β’). Apart from speed, the lateral acceleration signal is slower (read more) that the yaw rate (ψ’). The reason is that ψ’ has more transient content than the lateral acceleration Gy.
Therefore, if it is being analyzed the steady-state effect, the best parameter is the lateral acceleration Gy. In the case of a transient analysis, ψ’ is more significant. For this, it is necessary an extra sensor for the yaw rate measurement. Since β is zero at the start and the end of the corner, β’ will follow this trend.
The problem with those signal is that they are noisy, thus the errors accumulate with the integral. Hence, at the end of the corner, the integral might not be zero. However, in reality, it is zero. Figure 7 illustrates that there is a correcting β’ which the integral of β’ accounts for this difference. Hence, at the corner exit β is zero, thus due to this correction factor it is possible to get the correct β in the corner. To make sure that the integral is zero at the beginning and the exit, in this case the integral is not zero due to the error accumulations. However, the corner errors accumulated are a sort of βerror. Hence, β at the end is zero, because of the accumulation on error, then βerror is subtracted from β and then it is calculated β at the mid-corner. The difference between the real β and zero is an indication of the accumulation of this error. Actually βerror can be seen as an integral of β’error. Hence, the pre-definition of β is zero, thus it is firstly corrected the end of the corner condition as being zero. Once this calculation is done, β(t) is obtained compensated by βerror.
Braking
Braking is another maneuver that can be counted in order to generate a cumulative data. This channel is the braking distance. First, it should be defined what is braking. Usually, this defined by the longitudinal acceleration, when this is negative. In a similar manner to the lateral G, a threshold is defined to be considered braking. For this, some logic can be built, if this is a 0-1 channel, it informs if Gx is negative.
A threshold can be added in order to not account coasting situations. The distance of braking event can be calculated by dt times V, thus it is possible to create a math, which is the braking distance. From this, it is possible to make the cumulative of the brake distance in a lap (Figure 9). The braking distance can also be plotted in form of incremental and overlaid on the longitudinal G. The traveled distance is reducing together with speed. For this reason, the red line has a decreasing trend. When two datasets are being compared, the lap times could be different, thus there will be differences on distances. When the variance of the lap distance between two outings is made, it is possible to seen the gain or the loss in braking distance. For instance, after increase downforce, it would be useful to verify the end of lap value and the distances in each brake maneuver.
Delta Channel versus Distance
The variance can be the delta times between two outings as function of distance (Figure 10), this allows to visualize where the driver is gaining or losing time. Another examples of deltas are ΔRPM and ΔV as functions of distance. In addition, it is possible to build the cumulative of USOS as function of distance. Figure £ illustrates different setups being compared with respect to the cumulative of the USOS channel.
These data are divided between understeering and oversteering, and the cumulative, the average and the difference between them. Between those two setups it is possible to notice that these provides more or less the same amount of understeer, while the oversteer increases (cum us/os set 2). It also possible to spot these differences on the average data (ave set 1 and 2). The black lines indicate the differences between understeering and oversteering setup 1 and 2. The second transition exhibit an equal increasing of the understeering behavior for both setups. However, only setup 1 experiments a reduction of the oversteering behavior. The setup 2 becomes much more oversteering at the end of the sting. The speed trace (gray) helps on the orientation with respect to track position. Another delta channel in function of the distance is the combined G (Gxy) one.
This is a powerful data since Gxy is basically a measure of grip. Plotting the difference between two outings could be a bit erratic with respect to the visuals. However, plotting the two allows to visualize the differences between them. The cumulative of Gxy versus distance exhibits small differences in the end of lap. Clearly, the orange set has bit of grip loss. In the graph of the cumulative throttle, the red line is the difference of this parameter between the outing 1 and 2. Hence, the zero line represents no difference, but at the end there is a significant on throttle.
Statistics
At the end of all this analysis it is possible to compile some statistics. Figure 13 illustrates the main ones for steering, throttle, braking and lap distance. For steering, its RMS is a measure of the driver smoothness. The same observation is valid for the throttle. The ratio between lap distance and brake distance is a quick measurement of the driver effectiveness on braking. The statistics are numbers, thus these lose come connection to the details. For instance, if there are some driver mistakes or traffic interference.
References
- This article was based in the lecture notes written by the author during the Applied Vehicle Dynamics lectures attended in Dallara Academy;
- Knox, Bob. A Practical Guide to Race Car Data Analysis. Rev. 1. ISBN: 978-1456587918;
- Segers. J. Analisys Tequiniques for Racecar Data Acquisition, 1° Edição. Warrendale, PA. SAE International. 2008.
