
The composite materials used in racing car design are based on fibers and matrix, the first one are responsible for the high mechanical properties as high strength and stiffness. On the other hand, the matrix is the continuum medium and is characterized by a good shear properties and low density. In addition, the matrix links together with the fibers. Figure 1 (Cover) illustrates the correlation between the fiber and matrix characteristics. Regarding these and depending of the main character which is being focused, it is possible to notice in which region is the test and their respective standards. Considering the mechanical tests, the tensile and compression are the ones which the fibers and the matrix play the most important role regarding their properties. The flexural test, which the fracture toughness of the fiber and the fabric are realized and the characteristics of the matrix are important.

The differential scanning calorimetry (DSC) has properties only linked to the matrix. It allows to measure the thermodynamical variation and transformation of the matrix, because the fibers, glass or carbon ones, are realized by very high temperature processes. In this range, DSC is able to go from low temperatures up to 350 °C, for example, which is only able to measure the matrix. From the point of view of which technique it is used to measure determined properties, there is the categorization of the three main techniques used in the motorsport field, the mechanical, the thermal and the thermomechanical. The mechanical testing can test system or measure mechanisms that can be considered fibers or matrix dominated, while DSC is only matrix dominated.
Differential scanning calorimetry (DSC)
In this technique there are two different cell thermo sensors, one is put in contact with the sample, while the other contains an empty panel just to have the same characteristics of what the filled panel sensor fells during the test. Hence, from the two panels, one is empty and the second one is filled with sample under analysis. As far the temperature is raised or lowered, it is measured the heat flux going through the reference and the sample pans. The difference between them will be recorded as a peak, in case of exothermal heat flux, or as change in the slope of the baseline, which is usually the glass temperature transition Tg.
Thermal characterization
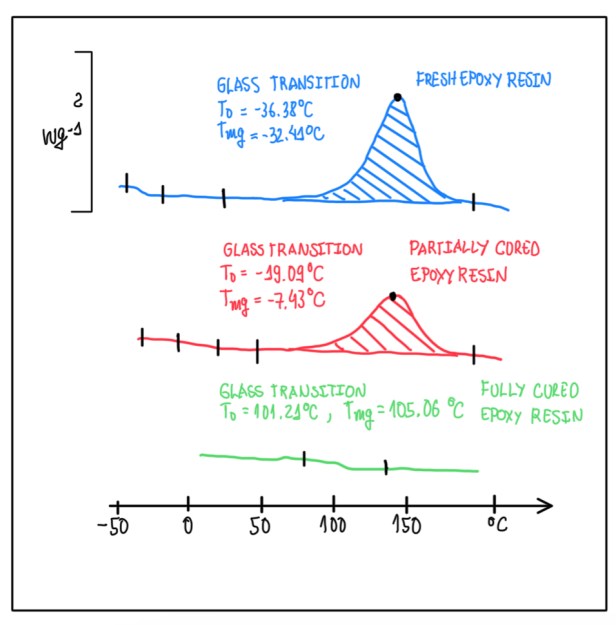
Figure 4 illustrates a graph with three different curves with respect to curing reaction of an epoxy resin. The curve 1 (blue) represents the virgin stage of the sample, that could be also a pre-preg or a simple matrix. The pre-preg is the fiber impregnated with a matrix. In the case of Figure 4, it could be an adhesive made by epoxy or a simple liquid adhesive. Since the blue curve corresponds to a situation which the sample is in a virgin condition, thus the process is started from the low temperature. It is observed the first glass transition at low temperature, that represents the very first ordered state of the system, then it is observed a peak, which allows to calculate the enthalpy of the reaction. Hence, the area below the peak represents the energy that is released during the polymerization process, the cross-linking one.
The condition represented by the red curve is a typical case of a partially polymerized sample. Hence, in this case Tg is higher and also the area underneath to the peak is lower with respect to the blue curve. In this way, comparing these two curves, it is possible to understand in which stage is the sample. This could be an example of the so called B-stage, which some of the mix are formed, but there are a significant number of crosslinks that should be closed by the reaction. The example of the B-stage is something that it is possible to be performed artificially. Hence, a proper cure cycle is analyzed in order to obtain only a partially polymerization of the system. For instance, for absorbing properties, since there is a significant plastic deformation of the material, the energy that can be absorbed is, somehow, higher or a manufacturing activated. This last case occurs when the component has some specific shape, which the polymerization is finished together with the manufacturing.
The third case is represented by the green curve. In this one, the fully cured sample exhibit Tg which is much higher than the previous cases. In addition, it is possible to define the sample as fully polymerized, which all the cross-links are closed. The softwares used to evaluate the DSC process exhibit the isothermal (IsoT) cycles and temperature ramps in different speed rates and allow to compare these informations with different materials. In this way, it is possible to measure and have different information regarding the temperature of the reaction, glass transition temperature Tg, reaction kinetics, polymerization process and all these depend on how they are combined.
DSC standards

DSC is described in detail by proper standards. The first one is ASTM D3418-12, it is used to determine Tg. In particular, this requires to perform a measurement at 20 °C/min. The process to find Tg can be observed in Figure 7. It should be found a point far from the first transition, a point at the end of the transition and a middle point, which is at the tangent line that is over the transition curve. Usually, Tmg is adopted as Tg. To compare different measures from different laboratories, it is required to perform the measurement at the same pressure, because Tg is a phenomenon that is strongly dependent on the speed which the system is heated or cooled. In addition, the testing speed defines different configurations of the cross-linkings inside of the body. This is the reason why Tg is strongly dependent of speed. Considering an amorphous medium and the low range order, the variations are dependent on the cure speed.
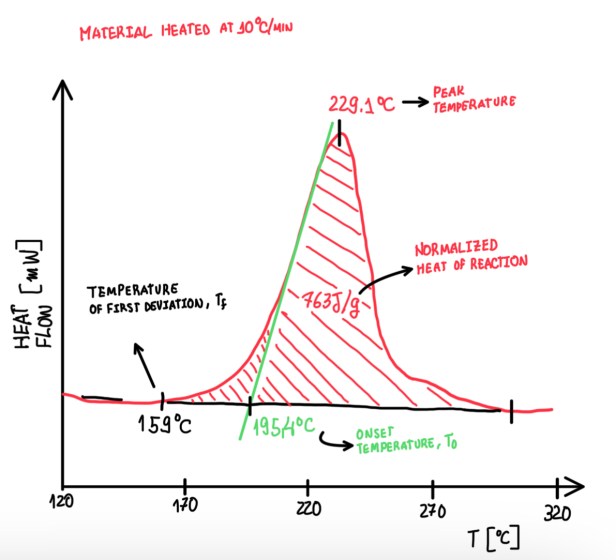
The second standard is the ASTM E2160, it evaluates the heat of the reaction, thus the endothermic reaction. In this case the speed is 10 °C/min and different parameters are defined as seen in Figure 8. The curve parameters are the temperature of the first deviation Tf, peak temperature T, normalised heat of the reaction and the onset temperature T0. The interest behind these parameters is that, the local content of the matrix influences on the values of these parameters. This is the reason that these measurements are normalised. For instance, in some cases a fabric pre-preg is impregnated with 40-58% of the matrix. Hence, taking 10 mg of the sample, there are only 3.8 mg of matrix that tilts the signal of the instrument.
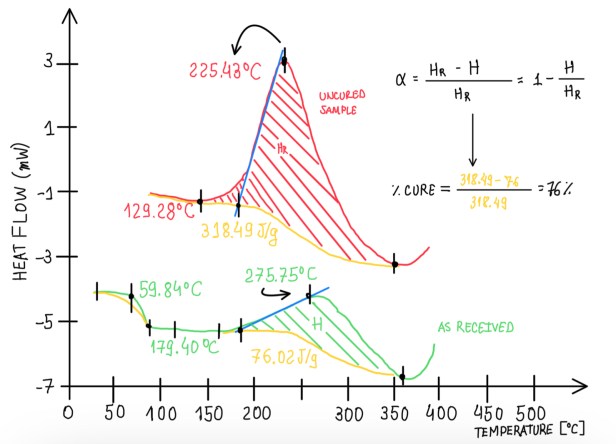
From this point of view, it is impossible to repeat the measurement several times and obtain exactly the same weight of sample, in particular, the same local concentration of material. This is the reason behind the normalisation, it reduces the numerical variation of some parameters due to the non-controlled aspects. Hence, it is possible to compare different signals. Another important parameter is the cure percentage or the cure degree of a sample. In order to calculate the degree of polymerization, it should be known the virgin state of the material, thus evaluating what is happening to the material.
Optional methods of thermal characterization
Although DSC is assumed as an exothermal technique, in other words, it is used to evaluate Tg at the end of the reaction for an epoxy, this technique can also be used to evaluate oxidation stability, elastomer analysis and curing of adhesives. In addition, it is possible to work with other kinds of materials as metals and plastics. It is possible to understand the polymorphism of plastics, that is something that happen with PED or PPC quite often, in particular if considered a material that comes from a recycled or partially recycled batches. From these examples, it is possible to understand that, depending on which is the idea regarding the knowledge of the material, it can be realized a plenty of different measurements.
Case study
The following examples are analysis performed in order to evaluate the applicability of fast and slow curing materials in compression moulding and autoclave processes. In addition, it is also verified the difference between these materials. These are based on examples of curing cycle simulations of ordinary epoxies. Considering epoxies, there are two ingredients that have an important role in the polymerization process, temperature and time. Depending of the temperature applied to the sample in order to cure it, it is possible to obtain different situations as a B-stage, cross-link components or an intermediate stage between the two. The objetive of this analysis is to verify the possibility of curing this material at lower temperature and/or time, and check the results.
Figure 11 and 12 illustrates examples of an analysis made on those epoxies at different stages. The blue curve is the virgin sample, while the red, gray and green curves are simulations of the virgin epoxy cured by exothermal processes at 30, 45 and 60 minutes, respectively, and at 100 °C. The supplier recommends a curing process of 90 minutes at 100-120 °C in autoclave.
It is important to consider some important aspects. The glass temperature in virgin materials is always lower than zero. Only few virgin materials have a Tg higher than 7 °C, these should not exceed 5 °C. If the temperature is higher, this means that the material has started an initial state polymerization. In addition, when the polymerization starts, Tg enhancers, thus the onset and peak temperatures also change. The material is considered as fully cured when the degree of curing is higher, 90-92%.
Time dependent materials
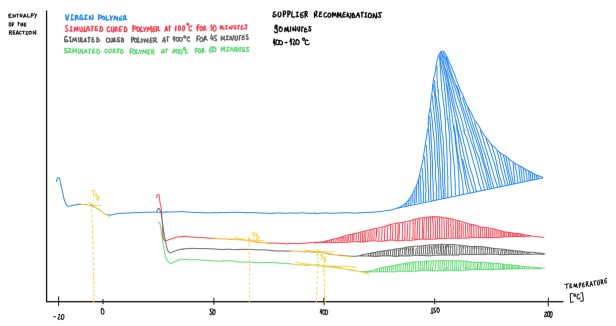
Considering what can be observed in Figure 11, it is evaluated the cure degree of the different samples. Clearly there is a significant difference between the curves red, gray and green. The area below the curve is bigger in the red one, which is coherent since this refers to a material that was polymerized for 30 minutes. Additionally, Tg from each simulation grow and reach almost the maximum that could be reached by this material. Another interesting aspect is that, each curve exhibit an area that decreases according to the curing time. Hence, regarding those aspects, it is possible to define that the material under evaluation is a time depending one.
Temperature dependent materials
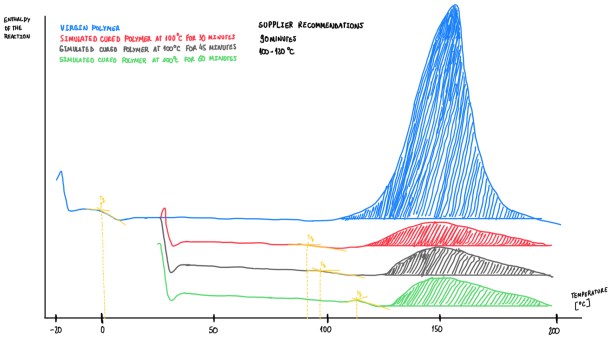
Figure 12 illustrates another epoxies simulations. The main observation is, the enthalpy of the reatcion of the three simuluations exhibit a very similar area. This suggests that, after 30, 45 or 60 minutes, the degree of cure, considering the experimental errors and the fact that for each measurement it is used a different small sample, is basically the same. Hence, this indicates that this epoxy is not time dependent, instead it is temperature dependent. Cases like that are called fast curing materials. These are mechanically developed to be cured in a very short time in a specific temperature, the time variant is not effective. The fast curing material it is a temperature driven material, if it is not applied the exact temperature, the material would not be fully cured.
Conclusion
The idea of this experiment is to verify if it is possible to furnace those materials at low temperatures, because high temperature processes are usually expensive. Another objective is to explore the possibility to use autoclave materials in compression moulding, or compression moulding materials in the autoclave. Those are quite antangonic processes, since autoclaves normally takes longer times for curing respective to compression molding. This process is commonly applied on fast curing materials. These are designed to obtain the maximum mechanical properties, because the morphology of the matrix after the curing process will be different depending on the type of curing process realized. Hence, in the case illustrated in Figure 12, it was done the opposite. The fast curing material was exposed to long cycles at lower temperatures. In the previous case (Figure 11), this material was an epoxy designed to react in longer times. Although the results highlight the characteristics of these epoxies, the decision of which one to use in compression moulding or autoclave depends also on the type of mould and material geometry.
In cases which the compression moulding is considered, it is used aluminum or steel moulds depending of the number of parts that are required. In addition, if these moulds were properly designed, it is possible to enhance temperature and reach also higher temperatures with respect to this. On the contrary, if it is being considered direct moulds that are realized with epoxy tables, some of them exhibit significant distortions above 100-110 °C. In autoclave, these materials are usually worked in epoxy mould, while in compression moulding is necessary metallic moulds. Otherwise, these will long to cure, thus it is not effective from the point of view of the whole process, since it will require too much time to reach the thermal equilibrium with the mould before to start the curing process. Another important detail is that, when working with compression moulding, if it is used epoxy mould in parts that have sharp edges, the risk of the mould get damaged is much higher with respect to others. Obviously, metallic moulds can get some damage if it is not carefully designed the parts, these will get interference or detached and break itself and the mould. It is important to understand that, epoxies are thermo insulated materials, thus the moulds made of different plates need very long time to react to the thermal equilibrium. From this point of view, these are good alternatives for autoclaves, in particular if it is interested in curing one or two components. However, for realizing several parts, it is better to use another technique, a temper, for instance. In particular, if it is requested to cure these parts in a lower time, otherwise the cycle for this material would be 45 minutes, but it should wait 5 h to reach the fully cured condition.
The fast curing material can be used in both, autoclave and the compression moulding processes, while the slow curing materials at the same temperature might be used on both. This is tolerant with respect to cycle interruptions in case of problems without lose all the material. In addition, low curing materials exhibit the jet time, which is the time that, at a specific temperature, the material becomes rigid. This is normally longer, thus this helps in the remotion of all solvents, air bubbles that are trapped inside the material thanks to the pressure, in autoclave, or in the vacuum if considered and automated process.
The fast curing materials are not tolerant, because if it is not applied the exact temperature in which these are designed, these will not cure. For instance, common autoclaves barely reach 160 °C, thus it is not possible to polymerize this kind of material in this kind of autoclave. It is important to consider that, these studies were made in DSC, which were put just 10 mg of material, while if it is being checked the same value on the real component, it should be expected different degrees of polymerization and different values for Tg. The reason is that, heating 10 mg of material is quite easy, but curing 5 mm2 of carbon or sandwiched structure is much different. Also in this case, it should be considered the thermal inertia of the system and the mould when curing.
References
- This article is based on the lectures notes written by the author during the Design Composite lectures attended at Unimore Advanced Automotive Engineering Course;
- Differential Scanninig Calorimetry for all requirements, Mettler Toledo Brochure;
- Standard Test Method for Heat of Reaction of Thermally Reactive Materials by Differential Scanning Calorimetry. ASTM E2160-0, DOI: 10.1520/E2160-04.
- Standard Test Method for Transition Temperatures and Enthalpies of Fusion and Crystallization of Polymers by Differential Scanning Calorimetry, ASTM D3418-12, vol.08.02. DOI: 10.1520/D3418-12E01.
- Woo Il Lee, A. Loos. Heat of Reaction, Degree of Cure, and Viscosity of Hercules 3501-6 Resin. G. Springer, Materials Science, Journal of Composite Materials, Published 1 November 1982. DOI:10.1177/002199838201600605
