
One of the most important aspects of a sandwiched component is the core. The definition of its properties are important to defined the Young’s modulus of the composite. When it is used a honeycomb, it is possible to calculate the stiffness of the composite due to its geometry. In addition, sandwiched components exhibit different performances according to its type, if these are plates, panels or beams. This article discuss the main aspects of a sandwich components regarding the core.
Core properties estimation
Previously, it was stated that, for skins, it is possible to use metallic materials as aluminum, glass fiber or composite fibers. A polymeric material can be used in a reinforced or unreinforced condition. However, when dealing with core elements, there are also a sort of materials and geometries. One one of them is the honeycomb.
Honeycomb core density


When calculating the properties of a composite, one of the difficulties is how to estimate the properties of the core. A foam, for instance, is considered reasonably isotropic material, then with some tests it is possible to calculate its properties. However, a honeycomb core is more difficult to estimate its properties. The reason is, because this is made by very thin foils which are joined together. However, to estimate the core density, in the case of hexagonal or square cells, it is possible to use simple formulas. These are ratios between the effective and the solid areas of the honeycomb section. Figure 1a illustrates a squared honeycomb cell. The material enclosed by the dashed square is just twice the side s of the cell, times the thickness of the cell by the squared value of s. The twice is due to the fact that, it is necessary two foils to build this cell (Figure 1) and s2, because this accounts the solid square. Hence, dividing 2•t0•s by s2, it turns out Wx, that can be seen in Figure 1.
Mechanical properties of honeycomb cores

Regarding the mechanical properties, the density relations can be used to create correlations between the Young’s modulus of the effective and the solid areas. Hence, a quite similar process as the one for density. The out-of-plane Young’s modulus of the core is given by ET, which is the correlation between the ratio of the densities WC and W0 times the Young’s modulus of the materials of the foil E0. For instance, considering an aluminum foil, the parameters W0 and E0 are the ones for aluminum. The density of the honeycomb is given by WC, thus it is possible to calculate the Young’s modulus of the honeycomb in thickness direction. The width and the length direction are generally considered zero, because this structure is a kind of accordion, thus it is very flexible. Hence, the same is applied for the Poisson’s coefficients, all of them for those directions are zero. If a honeycomb is pulled in thickness direction, it is not possible to observe any transverse strain or contraction. This occurs because the honeycomb is not a solid material, it foils deform almost independently from each other. Similar considerations can be applied for the out-of-plane shear modulus. These are important, because they define the shear stiffness in the planes TW and TL (Figure 2). These can be directly calculated once it is known the shear modulus of the foil material (G0). In the case of an isotropic material, GTW and GTL are very similar, or the same. In the case of a honeycomb core, the two parameters are different. In addition, they also change according to the shape of the cells, which can be a hexagon or square. For a square cell, the values for GTL and GTW are the same, while in the hexagon shape are not the same and they affect the shear modulus. The in-plane shear stress (GLW ≈ 0) can also be considered zero. However, in this case, is due to the flexibility of the core.
Experimental evaluation of the core properties and skin/core adhesion
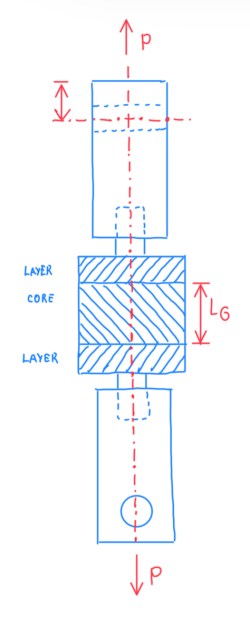
Some characteristics of sandwich materials can be evaluated under experiments, one of those typical tests is the flatwise tensile strength one. This is based on the measure of the core strength in the transverse direction, which may be useful also to estimate the shear strain and the measure of the bond strength between core and skin. In this case, it should be higher than the shear strength of the core. This is an approach to obtain a bonding that will resist to the stresses before the core fails. Otherwise, the bonding will fail before the core or the skin failure. If it is detected a failure on the core, this means that, the bond strength will be equal or higher than its value. Figure 3 illustrates the arrangement of the flatwise test. In the middle of it, there is a core specimen with two skins bonded to a sort of rigid plates. These are pulled apart by a machine that is attached to two pins. It is possible notice in Figure 3 that, those pins are oriented with 90° difference. The objective is to create a sort of hinge effect, in order to avoid bending on the specimen.
Compressive strength (ASTM C365)
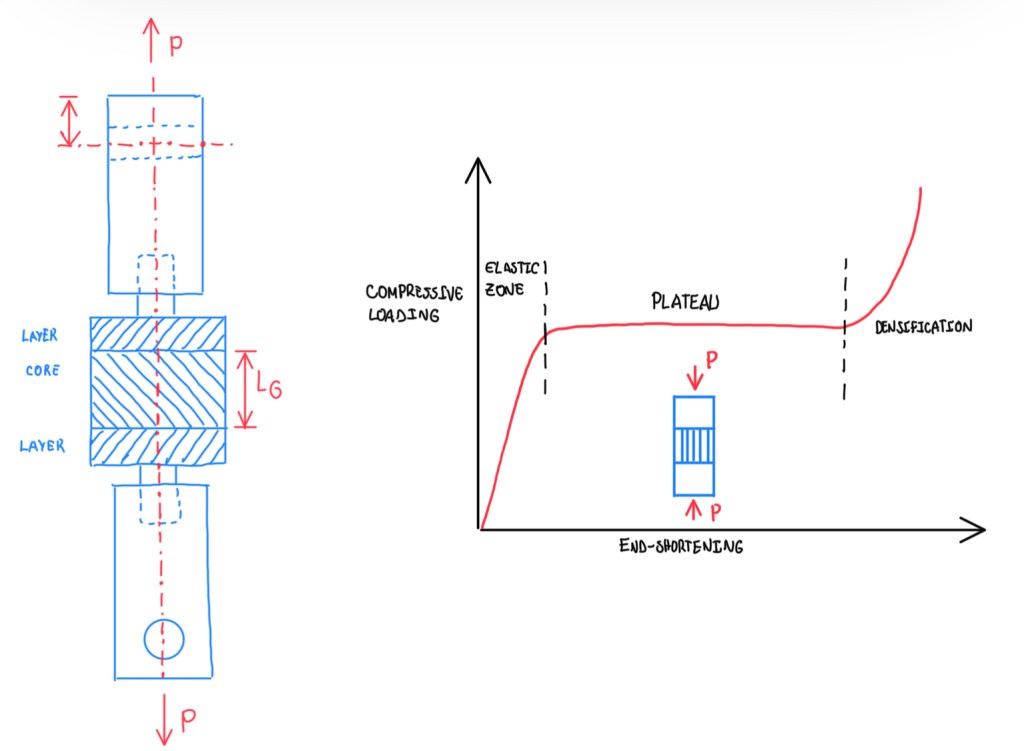
The compressive strength test is performed on the same arrange that the flatwise one. In compression test the limits for the core has to be defined. However, for foams or honeycombs, generally the stress-strain curve is very similar to the one seen in Figure 4. In the beginning of this curve, it is found an elastic behaviour followed by a plateau. Subsequently it is seen a stiffening when the material is experimenting a strain close to a compaction of the material. The plateau means the buckling of the sidewalls of a honeycomb or the buckling of the cell wall of a foam.
Shear strength (ASTM C273)

Another test is the direct measurement of the shear strength of the core material. However, this type of arrangement is not very common. In this one, the core material or the entire sandwich is bonded on metallic plates, which are loaded in shear. To measure the strain there is a linear transducer. Hence, it is possible to find the relation between the shear stress and strain. This one is just the shear displacement divided by the height of the core material.
Experimental evaluation of bending and shear stiffness
When dealing with sandwiched components, there are also proper methods to perform some experiments. As usual, there are standards for that. The main ones are the ASTM D7250 and C393, which are described in the next paragraphs.
Determining sandwich beam flexural and shear stiffnesses (ASTM D7250)

This test uses a three point bending configuration, but it is also possible to use a four point one. The deflection of the beam is measured at the load point δ. Then, it is used a theoretical relationship for the compliance, which is similar to the three point bending in sandwich beams.
∆ = ∆1 + ∆2 = (WL3/48D) + (WL/4V)
However, in this case, there are two unknowns, the bending stiffness Dx and the shear modulus Gxy. With δ and P, it is possible to calculate the compliance C. If the equation δ is substituted into the compliance definition, it is possible to build two relations (Figure 6). The first is the compliance C by the length L and the other is dividing C by L3. In the first case, the first term m1 is a function of L2 and the second term m2 is a constant. In the second case, the situation is different, m1 is constant and m2 is a function of L-2. Plotting both cases allows to verify the compliance with different lengths. The best approximation can be obtained with, at least, three tests. The compliance is rather constant in the linear regime. Hence, if it is not overcomed the linear elastic regime of the material, the compliance remains constant. It varies only in cases of a different span, which is the distance between the supports. This kind of procedure can performed for sandwich beams and for bulk laminates, in order to determine the flexural and shear stiffness.
Core shear properties of sandwich constructions by beam flexure (ASTM C393)
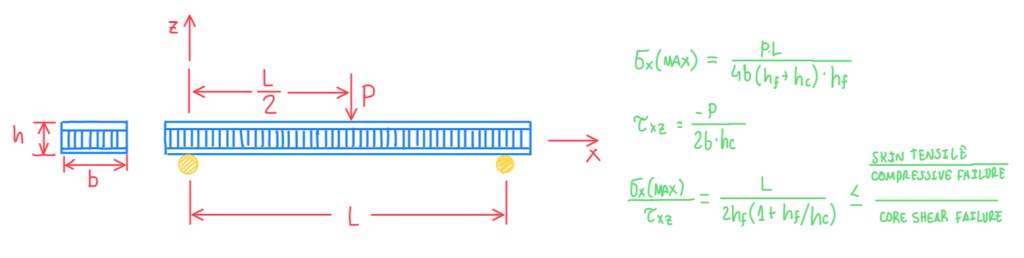
The approach seen previously can be applied for a sandwich beam. In this case, there are several mechanisms and the most probable one will be the failure in tension or compression of the skins or the shear failure of the core. The stress in the skin can be evaluated by the formula seen in Figure 7. Actually, these are just a different forms of the tensile and shear stresses described below and proposed by Carlsson and Kardomateas.
σ = M/(b•d•hf)
τxz = Q/(b•d)
Hence, the stresses in the skins are evaluated through the skin approximation. The same is applied for shear stresses. Performing the ratio between tensile and shear stresses allows to identify which of them is governing the failure. If it is compared the ratio between the skin tensile-compressive strength and the core shear strength with σX(max)/τxy, it is possible to make some observations. For instance, for a very long beam, the stresses in the skin is enhanced with respect to the shear stresses in the core. Then, the failure will occur on the skins. If it is made a short beam, L < 2•hf(1 + hf/hc), the core shear strength will prevail. Hence, depending on the length between the supports, it can be experimented both failures. In the case of PTC foam cone with some kind of reinforced polymer on the outside, it is necessary a 1.5 m long beam and this is quite unpractical.
Other standard tests
MIL-HDBK-23-A, Structure Sandwich Composites. Department of Defence, DoD USA, 1974;
DIAB Sandwich Handbook, DIAB AB, Sweden.
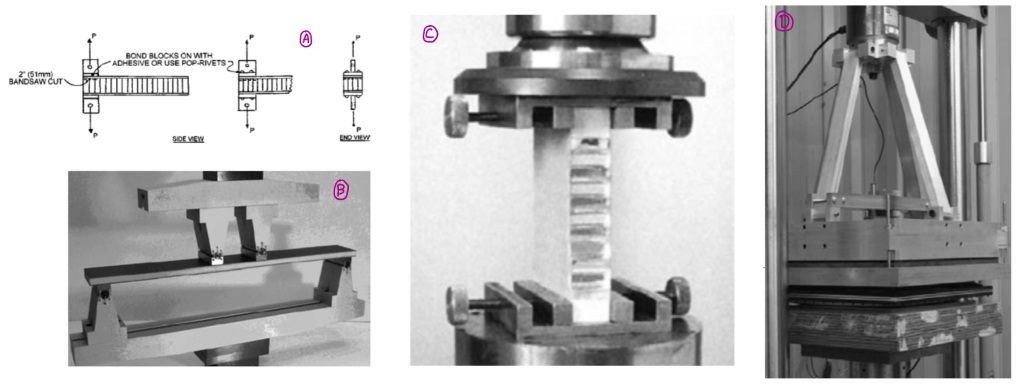
There are some other tests, which are done in order to determine the compressive strength of a sandwich edgewise (ASTM C365). This is a kind of test that, the sandwich is pushed in the plane of the facings. In this case, most of the strength is given by the facings, the contribution of the core is practically negligible. Another peculiar test is the two-dimensional flexural properties of simply supported sandwich composite plates. In this test, sandwich plates simply supported on the edges (Figure 8 – Picture D) are used. In addition, a sort of hydrostatic pillow is pushed in order to distribute evenly the pressure over the surface. The test illustrated by picture B (Figure 8), is the facing properties of sandwich constructions by a long beam flexure (ASTMD7249). This has a four point bending configuration and a machine applies the loads defined on the standards. The facing cleavage of sandwich panels (ASTM E2004) is illustrated by picture A (Figure 8). This test just measures the fracture toughness between the facings and the core.
Buckling load estimation
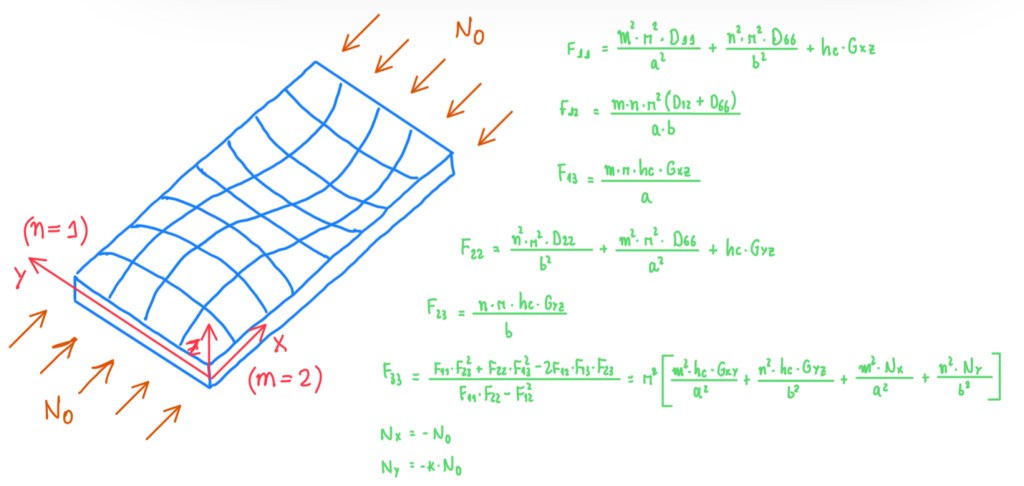
The buckling of panels may be important in several applications, because initially any geometrical imperfections that occur in a large panel can result in small instabilities when compressive loads are applied. In two dimensional structures, there are no instability as in beams. In these cases, if a beam is pushed in a point, there is a sudden instability. This occurs because a beam is an one dimensional structure. For a two dimensional structure there is no sudden instability like that, but there is some out-of-plane deformations that develop first. There are other out-of plane deformations which suggest that, the structure is not working well. There are some limitations due to the possibility to perform an analytical calculations. The series of equations seen in Figure 9 are just a sum of terms which depend on flexural stiffnesses. The terms D11 and D66 are those seen in the matrix of the stresses in the face sheets and core of the sandwich plate (Figure 9), which determine the stiffnesses of the skins which are spaced apart from a distance equal to the thickness of the core. The term Gxy is the shear modulus of the core, a and b are the size of the plate in x and y directions and m and n are the buckling loads along x and y directions. For instance, a half wave seen in Figure 9 corresponds to the first mode of buckling. This can be seen in a simply supported beam when compressed. The buckling mode is like an arch from one hinge to the other, which is a half wave of periodic function that represents the buckling displacement. Hence, a half wave is the first buckling mode, thus a complete wave is the second one. If there are higher modes, the waviness is more and more pronounced. All these terms are combined together in the F33 term. For the instability point determination, F33 is equated to the equation seen in Figure 9. The forces Nx and Ny are the ones that compresses the panel in the suggested directions. Then, the final equation, which is taken out of that, is developed for cases of proportional loading. This is the case where Ny is proportional to Nx, which is basically a compressive load N0.
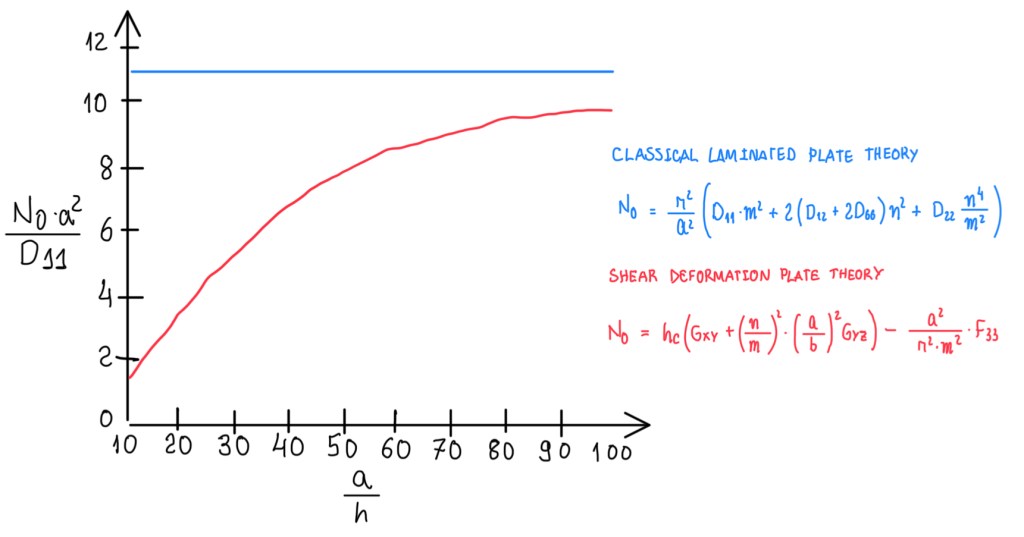
Finally, the solution is the one seen in Figure 10. This depends on the shear modulus Gxz and Gyz, the term F33, m and n. These two have values that make N0 to represent the minimum buckling load. This is typically obtained by m equals to n, which is equal to one. However, in general this condition can not be assumed a priori. It corresponds to a half wave along an unique bullet in two directions. The diagram seen in Figure 10 is just a comparison between a solution which comes from shear deformation theory and the one from the classical laminated plate theory. The first accounts all the contributions due to the shear deformation, while the second theory is simpler and does not include the shear deformations. This is an approximation which can be rather strong in the case of a sandwich plate. For the plate suggested in Figure 10, (0.5 x 0.5)m, subjected to a load N0 in the direction indicated and being unidirectional composite face sheets and an isotropic H100 PVC foam core, the values of all material and sandwich properties are known. In the case of a/h values of 10 means that, the height h is 5 cm for a of 50 cm. Hence, the panel of the example has the dimensions (50x50x5)cm. In this case, it is possible to notice that, the shear contribution lowers very much the value of the buckling load with respect to the one predicted by the classical lamination theory. For one and two orders of magnitude solutions, both are converging. The reason is that, the shear contribution is less and less important, the two skins are coming close to each other. When this occurs, the shear contribution due to the deformation is smaller. The shear deformation in plates is very important also for buckling.
Experimental evaluation of buckling loads
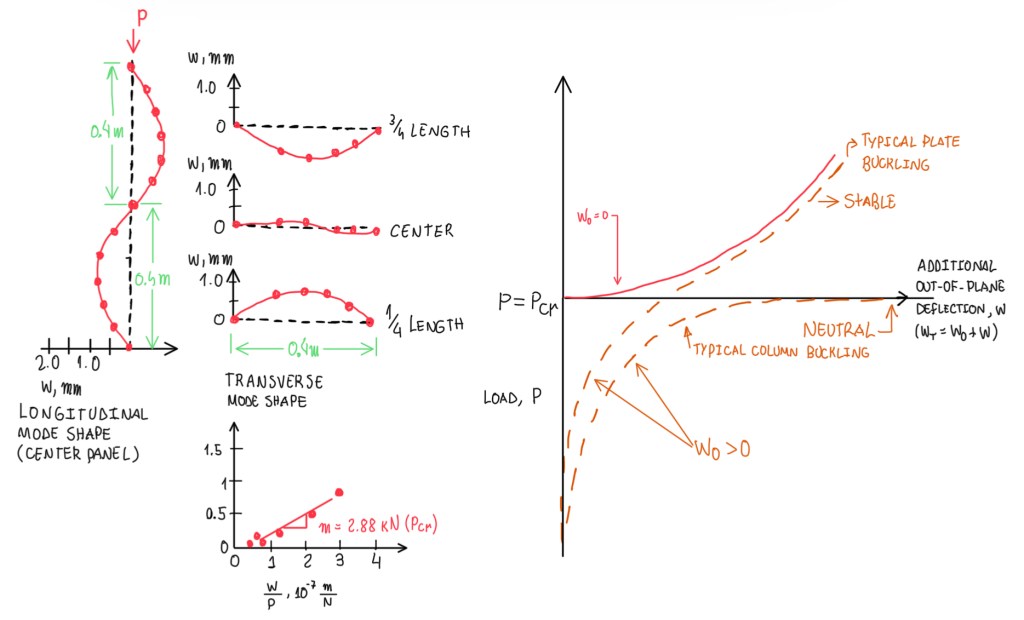
Buckling is not the same when occurs in plates, beams or columns. In beams, if it is verified the out-of-plane directions “w”, it is possible to notice that can be, apart of the total out-of-plane deformation, the structure that exhibits an initial out-of-plane shear deformation “w0“, or a geometrical defect. Hence, the total deformation will be given by the deflection due to buckling plus the one due to the initial deformation w0. However, in any case which w0 is equal to zero, if this occurs in columns, then this remains straight until the buckling load, then it deforms at constant load. The plates exhibit an out-of-plane deformation which increases, but the load also increases. The presence of an initial defect does not change significantly, because in the case of columns (Figure 11, dashed lines) at certain point it gets close to the buckling loads, then stiffness is almost zero. A horizontal line means that, the stiffness is zero, the ratio between the increasing load for an increasing deformation is zero. Hence, the stiffness comes to zero. In the case of a plate, the stiffness decreases, then re-increases. Therefore, the buckling of a plate is a kind of stable buckling, because for a rectangular plate the deformation may occur along the mid-plane and in one direction. However, in the transverse direction there are deformations that goes from zero to a maximum value in the middle, then it returns to zero. At this node (Figure 11), the deformation goes again to zero. Hence, basically, the plate is working as there are two external strips that tend to resist to buckling. In addition, there is an internal strip that tends to buckling. This is the way that a such behaviour has some stiffening after the buckling load. Therefore, the final failure of a buckling plate occurs when the external strips collapses, then everything collapses. The small diagram seen in Figure 11 is an experimental way to determine what is the critical load for this type of buckling. If the out-of-plane deflection is measured, it is put as function of the out-of-plane deflection divided by the load, w/p, which is the out-of-plane compliance. Then, it is generally got points along the straight line where it is demonstrated that, the slope of the straight line is approximately equal to the value of the critical load. This is an approach to estimate the critical load form an experimental test.
Collapse load estimation
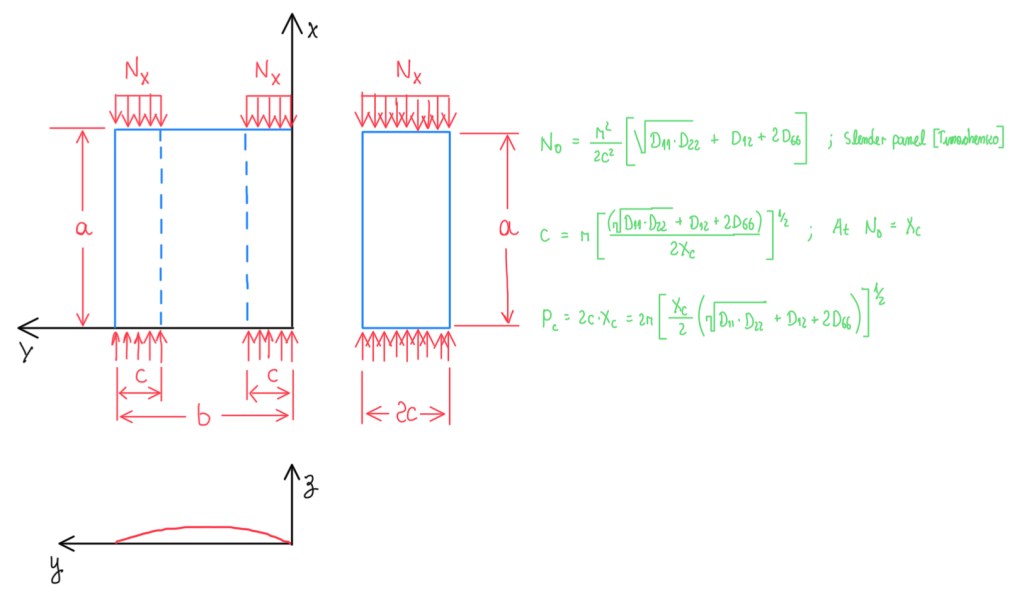
The critical load is not the last load, actually it is the ultimate one. This can be estimated when the two strips, those that resist to buckling, collapse. In other words, they reach the ultimate strength of the sandwich. Assuming that the panel is made by two strips, the lateral ones, which resist to buckling, and the center ones, which is under buckling condition, it is possible to consider that the load is mainly carried by the external stripes. Hence, the stiffness of the central strip, that resist to buckling, is negligible. Hence, all the loads are transmitted to the external stripes. Those are given by a length “c”, then the panel can be reduced to a panel under compression Nx and that has width 2c. Therefore, when this panel collapses, it will occur the collapse of the hole panel, because the central strip has already buckled. The value of the collapse load can be estimated from the formula for N0 seen in Figure 12. It comes from the instability of a slender panel, from the Timonschenko plate theory. If the value of the buckling load is equated to the one from the material strength, then it is possible to make an estimation of the length of the two stripes. In addition, from this estimation, it is possible to get the value of the collapse load, which is two times the length and the value of the strength of the panel. The strength is intended as the whole thickness of the panel, which is done by the two skins and the very small part of the core. This is the value that can be determined experimentally by the edgewise compression test. Once Xc is known from this test, then the collapse load can be calculated. It means that, first it is obtained the value of the stable buckling. Then, at the collapse value Pcr, it drops to zero, because the collapse of the entire structure occurred. This is something that can be managed by theoretical means of the buckling of panels.
Skin/core debonding
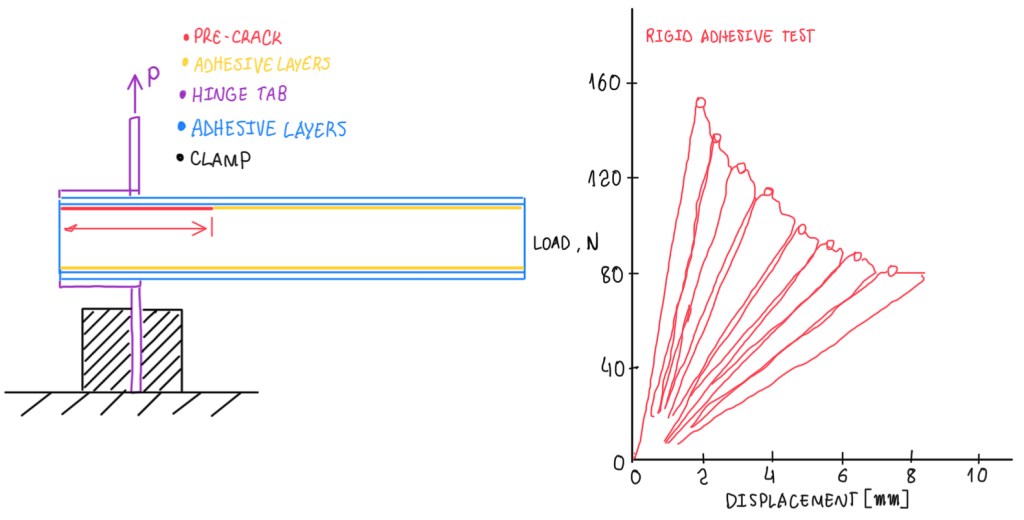
The skin/core debonding is a test to evaluate the fracture toughness. This test is very similar to the double cantilever beam test for the delamination fracture toughness of the composites. However, in the case of skin/core debonding, the delamination occur between the skin and core. The test is done for partial unloading and re-loadings. Hence, it is possible to measure the compliance during the test, because the slope of each of the lines seen in Figure 13 is the compliance of the specimen at different values of the crack length. Along each of these increasing load paths, there is a crack propagation. Hence, each of these points has a different value of the crack length. From compliance, the crack length can be determined and from load and displacements of the load points of the crack length, it is possible to find the fracture toughness.
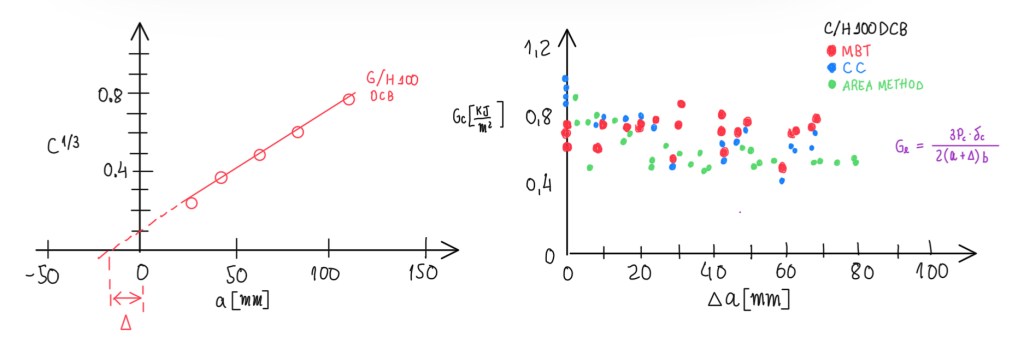
Figure 14 illustrates an example of a standard test (ASTM). It is possible to notice three different methods of evaluation of GC, but the results are about the same scatter ones. However, in the right-side (Figure 14), it is possible to notice a reasonable scatter, because this is an interface and fracture toughness on it can be very much influenced by the fact that, at some points there is the failure of the core, at the other the failure of the adhesive can occur and the failure of the interface between the adhesive and the skin. Hence, it can be much more valuable than the fracture toughness defined in the delamination test where there are two plies of the same material which are compacted without adhesive in between. This is something typically seen in adhesive joints, that the variability in fracture test is rather large.
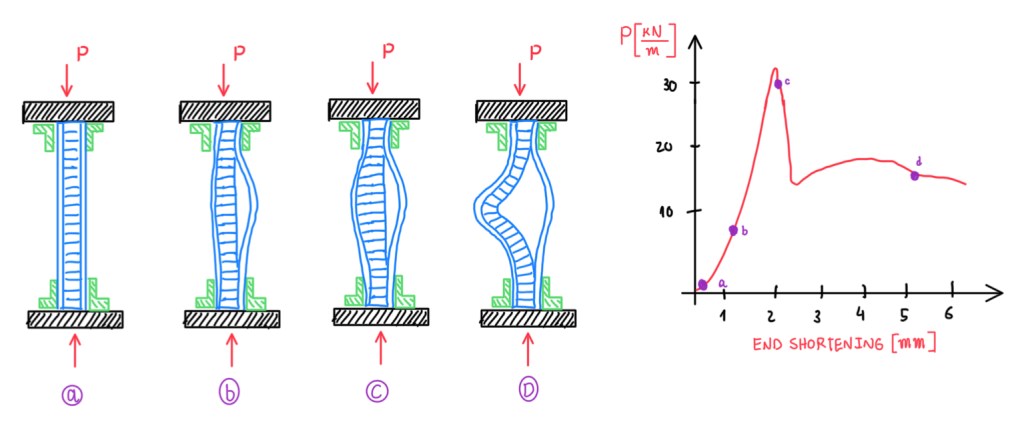
There is also another test for skin/core debonding evaluation which is more qualitative. It can give a value of the collapse load in cases of face wrinkling, which are the ones that the skin detaches from the core. Typically, this characterizes boding defects. Some weak bonds under compressive loads allow that, the unbonded portion purges out from the core. Then it is possible to determine the point C. After this one, there is a drop in the load, because the two separated parts are folding. This is an indication of the maximum load that the structure can afford in the case of a defect in the interface.
Reference
- Carlsson, L.A. Kardomateas, G.A. Structural and failure mechanics of sandwich composites. Springer, 2011;
- MIL-HDBK-23-A, Structure Sandwich Composites. Department of Defence, DoD USA, 1974;
- DIAB Sandwich Handbook, DIAB AB, Sweden.
