When something hit a carbon fiber chassis occurs an indentation, which is the superficial damaged caused by an impact. In racing field, usually it is caused by debris or small shanks. The problem is that an indentation can hide a critical damage. For this reason it is important to go deeper in this subject. This article proposes a summary of the main the details of the impact damage, its main inflicting factors, testing procedures and some comments regarding inspection.
Impact damage
The damage caused by an impact has four levels of intensity:
- Matrix mode;
- Delamination mode;
- Fiber mode;
- Penetration.
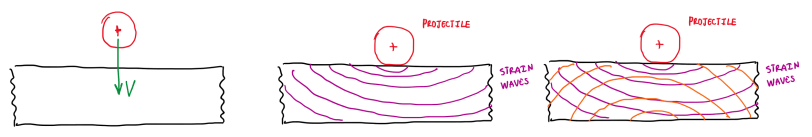
First, there is a low speed and energy impact that causes damages on the matrix, which is called matrix mode. The second level is the delamination, that occurs due to reasonably high speed impacts. The third level is the fiber mode, that occurs at similar conditions with respect to the delamination one. The fourth and highest level is the penetration. All those levels depends on the impact speed, thus energy. In addition, it is possible to notice that there is just one impact that is clearly visible, the penetration. Hence, the damages are classified in two groups, the barely visible impact damage (BVID) and the visible impact damage (VID). Usually, VID means penetration, but there are cases which fiber modes result in observable damages. The barely visible impact damages involves no penetration. The low energy impact characterizes BVID.
The first damage is the matrix mode. In this case, the damage tends to occur on the matrix, this means a crack on the fiber connections. As a result, they tend to separate causing a fiber breakage. This crack can occur due to tensile, compressive or shear stresses. The second type of damage still does not cause penetration, it is the delamination mode. The is generated by an impact with a bit more energy with respect to the matrix mode. The delamination mode start with splits or crack and due interlaminar stresses the delamination arises. In case of higher energy impacts with respect to these two, it is possible to have fiber breakage, which is the fiber mode of damage. This can be a BVID or VID, it depends on the speed. In some cases, a matrix mode evolve to fiber due to the fiber breakage. However, the fiber mode occurs due to a high energy impact, which tends to cause fiber breakage or fiber buckling, due to tensile of compression stresses, respectively.
Those types and classification of damages come from the aeronautical industry. It also has proper methods for inspection, which most of them are based into visual ones. Once a damage is spotted, there are techniques to evaluate it. The main problem is when a damage is not spotted since some of them are defined as BVID. Hence, the damage will increase until a moment that it reaches a condition no longer compatible with the ultimate load.
Cross-ply laminates
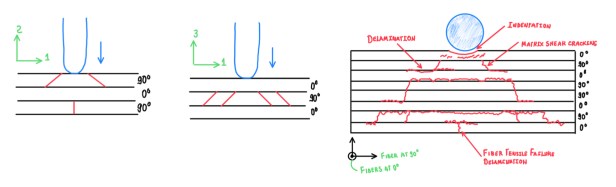
A cross-ply laminate is characterized by a sequence of plies disposed alternatively with respect to the ply orientation. The stacking sequence alternates between 0° and 90° plies. The objective is to observe the effects on a laminates, thus if this was a multidirection one, the matrix cracking would be almost suppressed. Hence, the cross-ply configuration has fibers aligned at 0° and 90°, the first is parallely aligned with screen, while the 90° plies are aligned perpendicularly to the screen.
Observing the laminate at the transverse view, it is possible to notice that, at the impact, the plies at 90° suffer from matrix shear cracking. However, this helps in protecting the 0° plies, which are the next ones. This does not exhibit damages on the fiber and on the matrix, since at 0° these plies work pretty well. The last ply, which is oriented at 90°, exhibit some damage due to tension. Actually, since there is a very high difference between the damaged and undamaged plies, delamination will begin at the last ply. This is the only way that, damage can propagate, by delamination. Another important observation is that, if there are matrix cracks in the 90° layer, then the next ply will be free of damages and stresses.
When the orientation is changed to a longitudinal view, it is observed a matrix cracks in 0° layer, but these do not cause delamination , which was already triggered at the transverse view. Hence, if these damages appear in ultrasound or x-ray, the top 0°/90° interface at the top will be matrix cracks with very small delamination, while 90°/0° interface at the bottom exhibits a significant delamination.
Considering a laminate with several layers at 90° and 0° being hit by a projectile. The trends observed in the longitudinal and transversal example are rather the same. However, these propagates along the material thickness. Hence, it is possible to conclude that, the large damage is always at the opposite surface with respect to the one in which the impact occurred. This is the main reason that, the delamination is difficult to spot even with proper ultrasound and c-scan methods. Nevertheless, there are othe ones that can scan each side of the laminate, but it is more time consuming.
Another aspect regarding cross-plies is about the material thickness. Usually, thick laminates can be stiffer than thin ones made from the same material. Considering a thick laminate, when it is hit, the impact force is higher than it would be in thin laminate. This occurs because thin laminates tend to be more flexible. As a result, the crack propagation occurs differently. In thick laminates, the matrix cracks just beneath the impact surface. In thin laminates, the crack propagation start at the opposite surface with respect to the impact ones. Once this sort of laminate tend to be flexible, the impact force is lower. If the impact force is very low, the delamination extension will be lower. Since the delamination start at the opposite surface, it is usually mentioned that it is symmetric. However, the symmetry is more a qualitative behaviour, it does not is precisely equal and inverted with respect to the laminate case. Hence, between those laminates, the propagation pattern is similar, but symmetric regarding the midplane.
In terms of the absorbed energy, this is equal since the only difference in this situation is only the thickness. Then, the peak of damage will be lower in thin laminates. The problem of these is that, if the impact force is low, this will no break the laminate. However, more stress is generated at the opposite side, thus a rupture occurs. Therefore, the laminate thickness defines material stiffness with respect two laminates made from the same material. This is capable to change the delamination pattern.
Load-Displacement plot
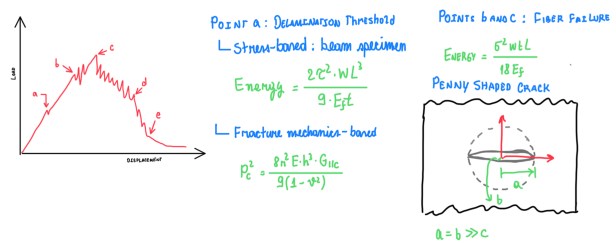
The load-displacement plot has several points which are defined by different approaches. Basically, 2-3 points of the curves are important, these are called the delamination threshold and the fiber failure. Considering a case which a specimen is being evaluated by a three point bending, this is an unidirectional 0° lay-up. Then, it is obtained the bending and the shear stresses. The first point is the determination of the curve section at which the delamination is triggered. This has a threshold load and energy which are given by the stress-based and the fracture mechanics-based approach, respectively. The first one defines the critical energy, which is estimated by the interlaminar shear strength. The stress-based approach is almost exclusive for this application. The fracture mechanics-based approach allows to estimate the threshold load. However, this method is only valid for an isotropic behaviour and a penny shaped internal crack. This is a special pore which its semiaxles have different lengths and the radial axles are much higher than the axial ones. In other words, the crack is circular with an infinitesimal vertical extension (Figure 9). The main point of this method is that, these cracks occur when the fracture toughness is overcame. This is cause be delamination, which propagates through sliding modes. Hence, this method solution is a critical load that return the relation between it and the fracture toughness. This is given by the Young’s modulus and the Poisson’s ratio of the material. Normally, it is considered a dependence of the critical load on the fracture toughness, which is the square root of this one. Similarly, the critical energy is defined by the square value of the interlaminar shear strength. For the fiber failure, this occurs in tension since it is also based on the three point bending. Hence, this approach uses the same data and have the same limitations of the previous one.
Other laminates
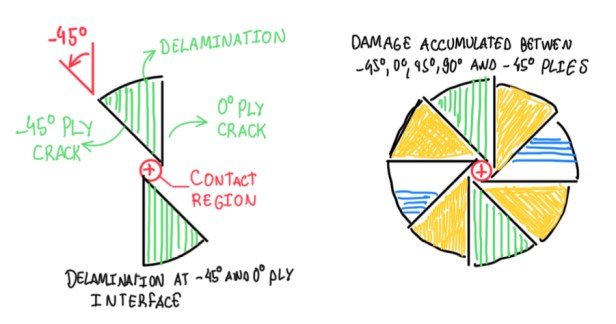
Another interesting case of delamination is the one that occurs in the so-called, angled-ply. Basically, this is a quasi-isotropic stack-up with plies disposed at -45°/0°/90° and -45°. The matrix crack and delamination occur in a sequence that the damages are spiralling towards the center, reversing its direction and returning to the back side. The angle-ply is usually evaluated at the microscopes or by applying a dye penetrant into the circular section edge in order to highligth the damage. The woven laminates are other solutions, which are adopted due to the benefit of warp and weft fibers. Its damage shape is also comples and difficult to predict.
Toughening of the resin
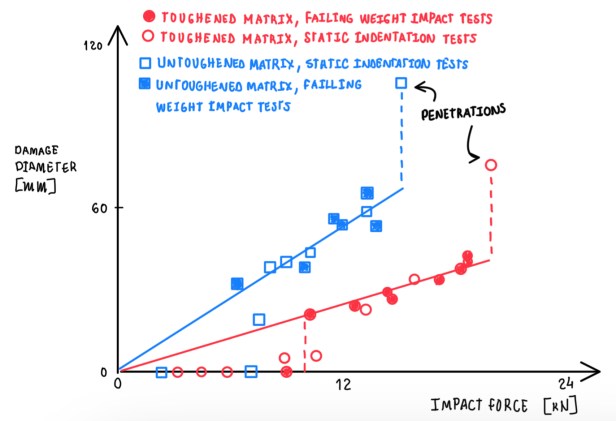
One of the possible methods to reduce delamination is by improving the resin toughness, or the interlaminar fracture toughness, more precisely the mode 2. Some researchers have found that, this parameter has a strong connection to the resistance against delamination under transversal load configurations. If it is compared to laminates with equal fibers, but with different matrices, it is clear that the tougher one will have a better performance. The plot of damage diameter with respect to the impact force results in a lower slope of the tougher matrix curve. This suggests that, a tougher matrix helps to contain the propagation of the delamination. In addition, the interlaminar fracture toughness also is a function of the thickness of the toughened matrix interlayers between the plies. This occurs, because thicker laminates tend to be stiffer than thin ones, but only if they have the same material. However, the toughening of the resin might result in a significant reduction of the compressive strength and reduced large notched tensile strength.
Impactor diameter and laminate thickness
The delamination is triggered by the impactor, thus it is interesting to analyze two parameters, the impact diameter and the laminate thickness. Actually, the impactor diameter is the main one, while the laminate thickness is more related to the lay-up configuration. There is a correlation between the impact force and these two parameters. The force exerted by the impactor has the same order of magnitude than the product of the impactor diameter by the laminate thickness at power of 0.5 and 1.5, respectively. This allows to plot several kinds of graphs correlating the force with the thickness and the impactor diameter.
Fi ∝ Di0.5∙t1.5
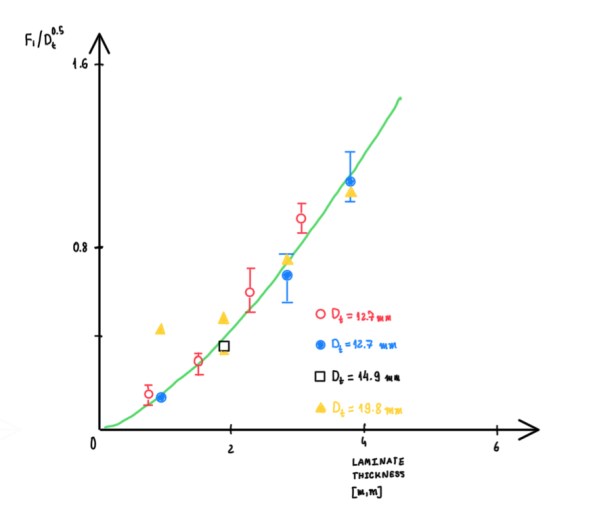
Considering both graphs (Figure 12), it is possible to notice that, the experimental results suggest a good correlation with the defined relationship between those parameters. The left-side plot correlates the ratio Fi/Dt0.5 with the laminate thickness at power of 1.5. In this case, the correlation proposed was tested with different impactor diameters. Most of them have exhibited a good correlation with the curve given by the approximation. The only exception was a test done with a 19.8 mm impactor diameter. In this case, the specimen was thin, thus combined with bigger impactor, the test results in a big impact force with a limited flexibility.
The main point of this graph is that, the value of the damage initiation force divided by the square root of the impactor diameter follows a relationship with respect to the delamination thickness at power of 1.5. The results suggest that, it is not possible to define if the diameter has some influence on the impact, because all impactor performances are spread along the curve. However, it is clear that, the lamination thickness has a strong correlation with the laminate capability to absorb the impact energy.
Delamination area
The delamination area is very difficult to predict, but there are many studies and approaches proposed for that. These establish correlations of the damage area with the impact force, the laminate thickness, the maximum force and the absorbed energy.
Impact force
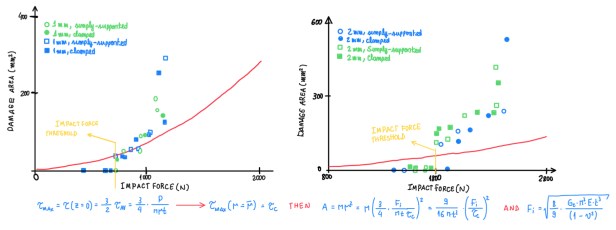
Regarding the impact force, there are some methods to correlate it with the delamination area. One of them is a study which two specimens were tested in two different configurations, simply-supported and clamped. The specimens only differ in their thicknesses, which are 1 and 2 mm. A clamped arrange restrains the specimen by all its contour. This method states that, the maximum shear into the specimen is three halves the average shear (Figure 13). By the formulation, it is possible to leave the maximum shear in function of the initiation force, the thickness and the delamination area. When τmax reach a value that overcomes or equals the critical shear, which is the interlaminar shear strength, it is possible to calculate r corresponding to this condition. This is the proximity with respect to the impact point and can be placed in evidence in order to have the crack radius in function of the maximum shear, the initiation force and thickness. Since it is being considered that the delamination is a circular crack with radius r. Then, the delamination area is obtained in function of the initiation force, the maximum shear stress and the laminate thickness. Once the critical shear is reached, it is set the initiation force. Hence, analyzing both cases, it is possible to notice that, the experimental results for the 1 mm thick specimens have a reasonably good correlation with the approximation. However, the experiments for 2 mm thick specimens exhibit no correlation with the approximation proposed by the formulas. Then, for the first specimen, the square root approximation is a good representation. In addition, in both analysis, it is possible to notice the threshold of the initiation force. Below this point, there is no damage. When the delamination is triggered, then the initiation force is defined by the fracture approach. However, at some point, in both cases, the damage area continues to increase even though at almost the same load. Hence, the fracture mechanics can no be applied anymore. In the case of 2 mm thick specimen, the approximation is rough, not accurate. This specimen rapidly becomes out the fracture mechanics condition. Therefore, it can be observed that, the thicker laminate, the lower the validity of the fracture mechanics relationship. Actually, up to now, there is no accurate relationship between damage area and the impact force in thick laminates, but it can still be used as a rough estimation.
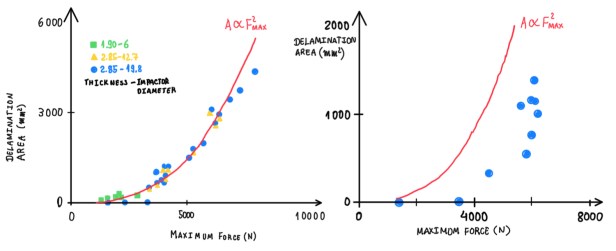
Another correlation is the one between the delamination area and the maximum impact force. This is usually the case when the approximation for the impact force can not be the power of two (Figure 14). Hence, it is proposed the one for the power of 2.9 of the maximum force. There are two cases, one test with specimens supported by circular supports of 50 mm diameter and the other with 100 mm diameter. As can be seen, for the tests performed with 50 mm diameter support, the approximation fits quite well with experimental results. However, this is not the case for the 100 mm support. In this case, there is a clear off-set between the approximation and the experimental results. This occur due to the test arrange. In this one, the specimen is supported at the periphery. Hence, the 100 mm diameter support is used, the unsupported area on the specimen is lower. Then, the specimen tends to be more rigid. A similar effect is observed when analyzing the thickness variation. As higher this one, higher is the extension of the delamination. Therefore, a bigger support result in a smaller unsupported section leaving the material more rigid and a thicker laminate also stiffens the specimen, the both situations result in a higher delamination extent due to the low flexibility.
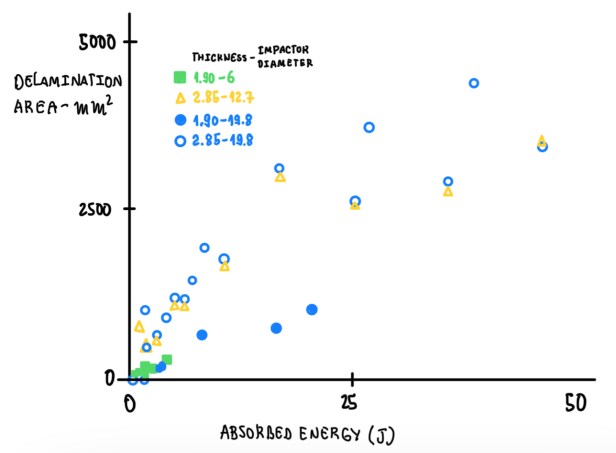
The third correlation is with the delamination area and the absorbed energy. Actually, the previous thickness correlation also is strongly connected with this one. In this case was used different impactor and specimens regarding diameter and thickness, respectively. It is possible to notice that, for the same absorbed energy, the thicker specimen has exhibited almost the double of the delamination of the thinner one. Since there is a relation between thickness and the impact force, if the thickness increase the delamination area and the impact force also increase. Therefore, the impact force depends on the laminate stiffness and the energy of the impact. The thicker the laminate, the worse the damage.
Strength reduction
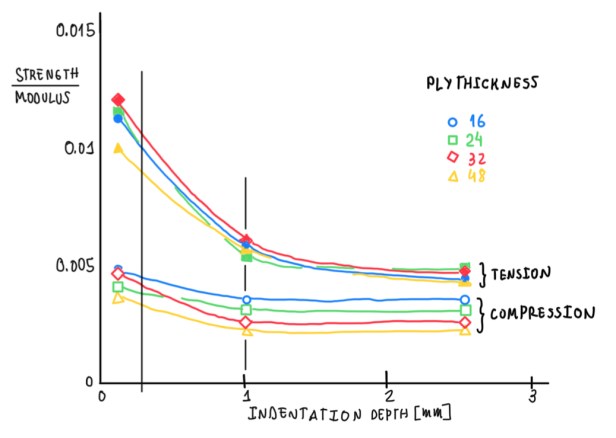
The strength reduction is the main concern when analyzing delamination. Its damage itself does not cause the immediate failure of the laminate. Actually, what really occurs is a gradual reduction of the strength of it. When it is reached a threshold, the laminate fails. Up to now was discussed the parameter as thickness, stiffness and impact force. Another one is the indentation and its depth. They are often related to the impact energy and the strength to modulus ratio. These are the parameters used to graphically describe the strength reduction. The indentation is the type of the deformation that is caused due to impacts. It is a depression of the surface at the impact local. Neither all indentations are visible by a naked eye. This make them a critical problem. Usually, indentations about tenths of millimeters are only visible with the support of inspection lights. It only becomes visible when it exceeds 1 inch (2.5 mm),m but at certain distance. However, the important point is how much strength was lost with respect to the indentation depth. The plot of the ratio between strength and Young’s modulus and the indentation depth illustrates that, there is a clear reduction. However, this is not balanced between compressive and tensile strength. For some tenths of indentation, the loss in the compressive strength is higher that the one in tensile strength. This occurs because delamination causes a significant decrease on the buckling loads. Hence, the failure mode change from the fiber compression to the fiber crash due to buckling. When the indentation depth is about 0.5-1.0 mm, it is also possible to notice that, the tensile strength is reduced in a similar magnitude to compression does. In this plot, it can also be observed the effects of the thickness. The higher the thickness, the higher the strain and the damage extension.
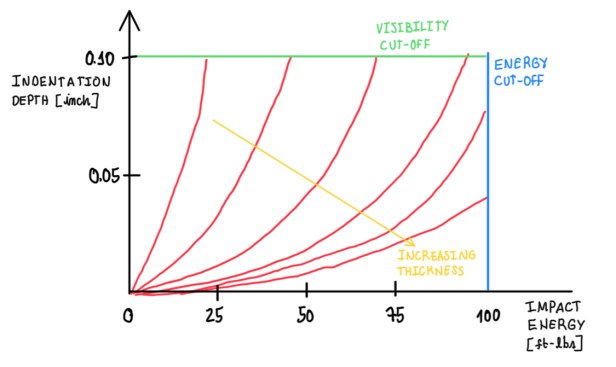
Another useful plots are the ones correlating the indentation depth with the impact energy. It is possible to notice a cut-off region at 0.10 inch (2.5 mm). This means that, if there is such damage, the structure must be repaired, because it is not possible to estimate the damage inside. Hence, as soon the indentation observed during inspections are inside the cut-off region, it is possible to estimate the impact energy and then, the strength available. This is done by another plot, which correlates the indentation depth and the ratio of the energy to the penetration energy (U/Up).
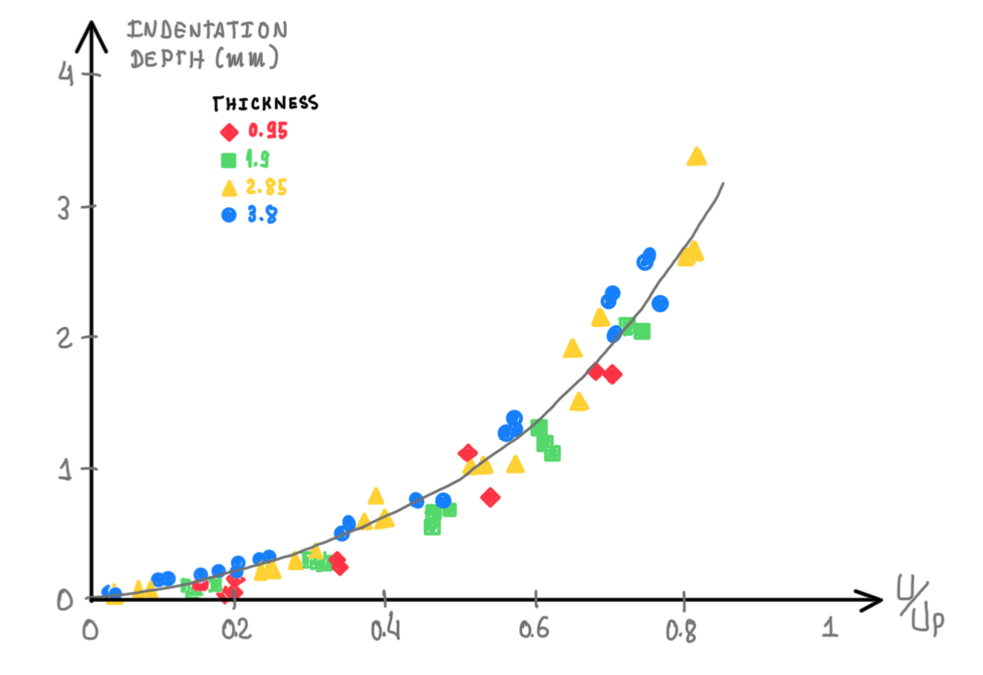
This last one is a parameter which depends on the laminate properties. In this plot, the objective is to determine if the residual strength still is compared to the nominal one. Then, with this information, it is possible to determine the reduced strength as a ratio between the residual and the nominal strengths from the ratio between the maximum energy without impairing strength and the impact energy (U0/U)k.
Damage identification
In terms of the motorsport field, the inspection approach is different from the aeronautic field one. Thus performing several impact tests for each type of laminate in order to build scatter charts, are done for the general use. For economical reasons, the inspection problems rely on a combination of very frequent and relatively simple analysis methods, as visual inspection. It is also performed some non-destructive techniques, but these are less frequent and for more localized areas. There is a type of operation called big revision, in air planes, which is based in the exam of the structure deeply. The walk around is a simple method. The objective is to spot if there are punctures or large areas of indentation or fiber breakage. The general visual inspection can exam large areas with the help of lighting and removal of fairings or access doors in order to gain proximity and clarity. It is also common the use of mirrors to observe corners and crevices. If there is some damage after inspection, it is performed the detailed visual inspection. This performs a more deep inspection by a close proximity visual inspection. It is also used more sophisticated techniques as grazing lights. If there are internal areas with damage suspicion, then a non-destructive technique should be used. These are called special detailed inspection. These are used when it is necessary to identify if in some localized region there are internal damage. The main techniques are ultrasonics, X-ray and shearography. For example, in composite chassis, the structure in monitored by optical fibers embedded into the composite. The objective is to have from the change of the signal that something start, to change due to damage, service loads or shanks.
The ultrasonic inspection is based on the propagation of waves into the material. When there are discontinuity of the waves, these are reflected or deviated. Hence, it is possible to define where is the position of the crack. The mechanical impedance analysis is something based in the excitation of the structure. If this is damaged, the response to vibration is different in a localized region. For internal damages, it is used the X-ray radiography and the infra-red thermography. This last one is based in thermal images, which exhibits the radiation that comes from the surface. Hence, it registers the surface temperature. If the sample is heated from behind, then it is possible to visualize the thermal wave through the thickness. In the case of damages, these waves are slowed down, thus it is observed a different thermal image at the surface. Hence, the thermal map is distorted in function of the defect that is beneath the surface.
References
- MIL-HDBK-17-3F, Volume 3, DoD USA, 2002;
- Busco, A. Comportamento all’impatto dei materiali compositi. Tese di dottorato, Università di Napoli “Federico II”, 2007;
- Borelli, R. Sviluppo di procedure numeriche per la simulazione del danno in strutture in composito. Tese di dottorato, Università di Napoli “Federico II”, 2011;
- This article was written based on the lecture notes written by author during the Design of Composite lectures attended at Unimore.
