
Since shrinkage is a problem that affects matrix materials and it depends on the chemistry and the electrons distribution inside the molecule, it is necessary a proper measurement process to evaluate the matrix. The objective is to characterize the material regarding the chemical and physical variation as a function of the temperature and time. Hence, an analysis considering a specified ΔT or, in some cases, the temperature is kept constant while it is observed how the material properties change as a function of time. The most widely used technique is the differential scanning calorimetry (DSC).
Overview
DSC is one of the most used thermal analysis techniques. It can be used in wide range of the temperatures and materials. This analysis basically measures the temperature and the heat flow associated with the material transitions. Hence, from this point of view, it is possible to observe all the thermodynamic transformations in the temperature range during the DSC test inside the thermogram. This could be the result of the experiment.

In the case seen in Figure 2, it is possible to observe quantitative information regarding endothermic or exothermic transformations that occur inside the material under DSC test. For instance, the endotherm transformation is characterized by heat absorption along the process. Normally, this kind of thermodynamic transformation is usually associated with the water crystallization process, an example of an endothermic state. Conversely, in the case of an exotherm transformation, one of the examples is the polymerization process. In this process the cross-links and bonds are realized, then the heat is released due to the reaction. From the point of view of the thermal process, DSC is a technique that is mostly used for polymers, which are characterized by both endotherm and exotherm processes. In addition, the organic materials are also examples of material evaluated by DSC. Another example of DSC applications are chemistry and biology. The ASME standard states that DSC allows the observation of transitions in which there is heat capacity associated with them, the so-called first stroke transitions. It is also possible to evaluate the metals, which have melting and crystallization temperatures. In some cases, DSC can be used to evaluate ceramics, which are able to expand after a very high temperature.
Operation principle
The DSC operation principle is based on a cell that contains two ingredients. The first one is the heat, thus it is necessary an external source of heat that can bring the material to its thermal transition. The second ingredient could be a gas, but it is not compulsory. Actually, this can be according to the type of testing. For instance, considering the thermal transitions that occur due to the oxidation of the compound. For cases like that, an inert gas is injected inside of the furnace. Nevertheless, there are some applications which are necessary to understand when the oxygen is present inside the chamber and the temperature since the structure is being heated. In this case, an external source is giving a sort of boost for the reaction. Therefore, the optional use of an inert gas gives a range of different test environments. Usually, for chassis design DSC applications, the tests are performed under vacuum, the inert gas is mostly used to prevent oxidation inside the furnace. The reason is that, for some cases, reaching high temperatures and keeping them in that atmosphere helps in having a higher life of the instruments. All electronics and parts of the instrumentations are subjected to failures and oxidations.
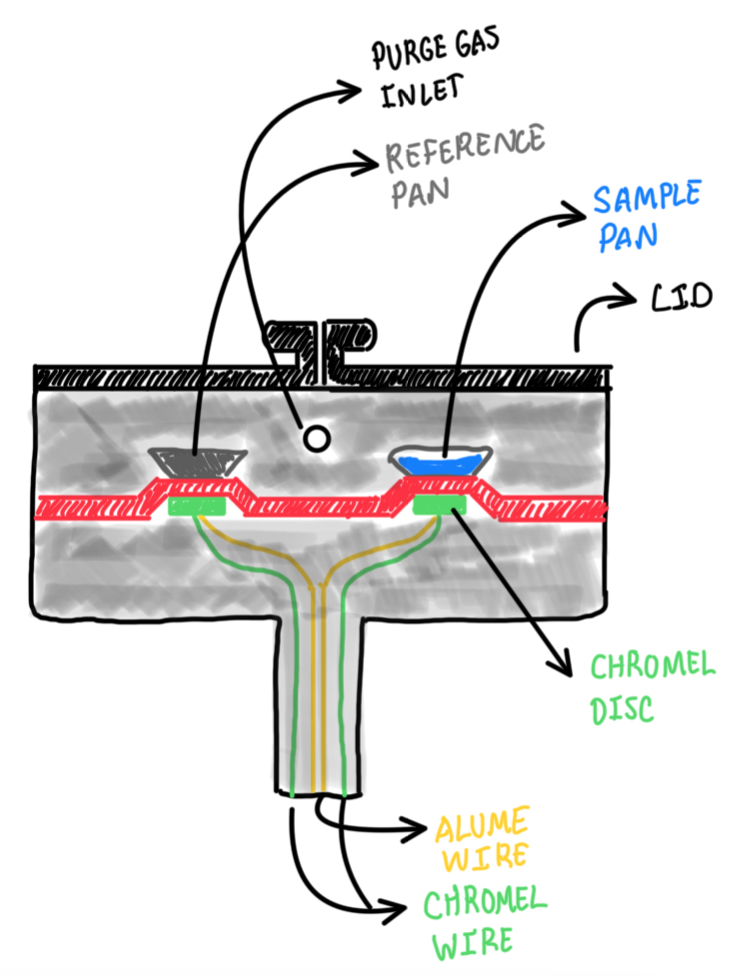
The DSC equipment has a closed chamber, which there is a source of heat. In addition, there are two different pans, one is empty and the second one contains the sample. Below these there are thermocouples, that register the temperature that is below the sample of reference. Since there are two different sensors, in this case temperature and heat flux ones, it is possible to understand the reason why this experiment is called DSC. It is necessary to compare signals between the reference and the samples at each time along the experiment. Hence, the electronics of the instruments make the difference between the two signals, thus it is possible to understand what happens with the sample along the test. For instance, considering a test, which there is the void reference pan and the sample pan, which is holding the thermoset polymer. The experiment starts at low temperature and it is expected that the sample suffers polymerization along the test. Then the furnace heats both pans and their respective sensors at the same temperature rate. At the beginning, the difference between the signals remains equal to zero. This suggests that, the sample is overcoming any sort of chemical transformation. At a certain point the sample begins to react, the polymerization starts, then it is established as an exothermic reaction. Hence, the sample pan is hotter with respect to the reference one. Then, the furnace should provide to the reference pan a higher value of heat, in order to keep the difference between the reference and the sample pans equal to zero through all the test. In such manner, it is possible to evaluate which is the heat flow that the sample is providing to the thermocouples and sensors during the polymerization process. In the case of the crystallization process, thus an endothermic reaction, the sample pan is absorbing heat as all the system is at the right temperature to make the thermal transformation. Hence, in this case, the furnace should provide extra heat to the pan which is extracting power.
The main reason behind complexity of this test is that, performing this sort of heat flow and direct measurements is extremely difficult from the point of view of the technology available. The reason is that there is a very strong noise that comes from all external sources of heat variation. Hence, the technique of performing differential measurement, in the case of the temperature and heat flow, is due to the electronic aspect of the DSC device. Actually, performing a direct measurement of the heat flow is the real limitation. The one for the temperature is easily done by thermocouples in each pan. The sensor is not a single thermocouple, instead it is a set of ones that can be arranged in different shapes. Then, an average of the signals are performed in order to provide a more precise temperature.
The DSC device is normally fed by an inert or purged gas, this is used in order to keep the sample space and the furnace in optimum conditions. This could be the case for materials that strongly react when in contact with the oxygen. The gas can also be an oxidizer, thus oxygen can be introduced to study this kind of reaction. It is possible to perform a DSC test under pressure in order to study these reactions regarding volume transformations. When pressure is added, the internal mixture changes its phase diagram and, in some cases, it is possible to change the crystallographic structure of the material. Hence, DSC experiments at high temperature and under pressure can be performed in order to analyze structural transformations of the material. This is not the case for polymers, instead it is more related for inorganic materials.
Thermogram
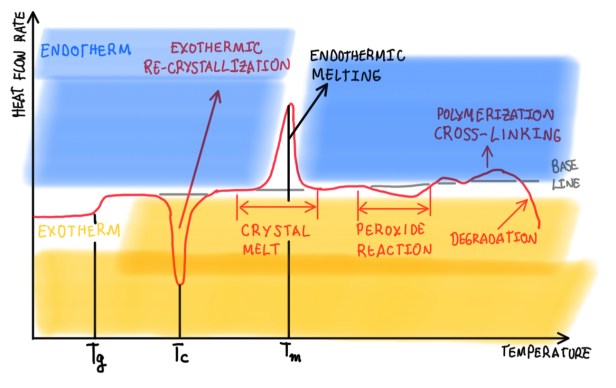
Figure 3 illustrates an usual graph of a DSC experiment, it records all the possible transitions during the test. This is the thermogram, it is composed by the x and y axis, which are represented by the temperature and the heat flow rate. Usually, it is necessary to define the exothermic and endothermic peaks regarding their sign. In the case seen in Figure 3, the endothermic peaks are being considered positive, while the exothermic ones are considered negative. The system is characterized by a first transition, which is the glass transition that occurs at a temperature Tg. After that, it is observed the re-crystallization, in other words, an exothermic peak, that is connected, for instance, to the case of epoxy matrices through the cross-linking. It is possible to observe the exothermic transformation, for example, the melting. In the case of thermoplastics, they will have a thermoplastic peak. In this case, this is an example of a peroxide reaction, which is possible to observe and measure a chemical reaction inside of the sample. The presence of cross-linking has a double peak, then the degradation of the sample occurs. The thermogram in Figure 3 is just an ideal representation to illustrate how those transformations appear on it. The idea of having an exothermic or endothermic reaction is not strictly related to the fact that the structure is being ordered or disordered. The crystallization normally is an endothermic reaction, but regarding polymers, they are not realized in crystals. Hence, when an endothermic reaction occurs, the heat is absorbed and re-crystallization occurs. However, in the case of the epoxy, the effect of polymerization is fully endothermic, it realizes heat. Actually, there is a risk of having a burned chassis or component, if the exothermic peaks are not considered. The cross-linking on the epoxy is a polymerization one, because the cure process occurs due to the cross-linking, thus it is an endothermic reaction.
Sample pans
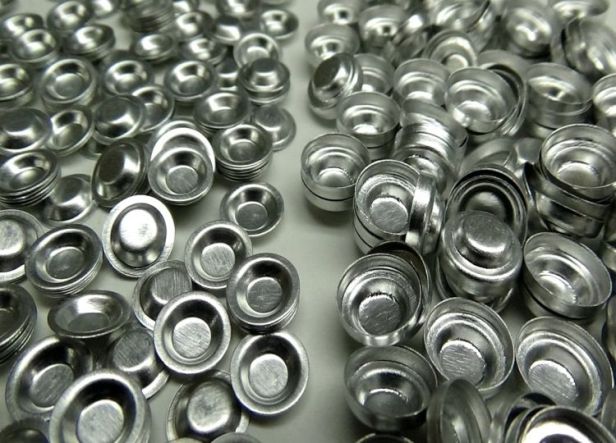
To perform the DSC tests, different types of sample pans are used. For instance, to evaluate ceramic materials, aluminum pans might not be the ideal choice, because the temperature to melt it is lower than the one for the ceramic. The sample pans can have different shapes and volumes, these characteristics depend on the material state during the experiment. These can be liquid, solid or even powders. In addition, the range of materials allowed to these experiments is wide, including ceramics and metals, such as aluminum and copper. Actually, DSC is very flexible in terms of the kind of tests that can be performed, because just combining isothermal n-runs, it is possible to realize a lot of different experiments. For instance, it is possible to measure glass transition, melting point, analysis of salinity and kinetic reaction. Hence, it is possible to perform an analysis which is the time to fully cure a sample. Another kind of experiment is the one that considers the sample in an oxygen environment, it measures the cure degree and the reaction kinetics.
Standards
Since this test should be performed in laboratories around the world, it is necessary to guarantee its reproducibility. This is the objective of the standards. These are necessary for all tests and experiments in order to reproduce the same conditions in different contexts. Regarding the differential scanning calorimetry, there are two main standards that are different from the other, because they are focused on two different characteristics.
ASTM D3418-12

The ASTM D3418-12 standard is focused on the calculation of the glass transition temperature (Tg). It states that, it is necessary to perform the measurement at 20 °C/min and Tg should be evaluated considering a point far from the transition, then it is drawn as a tangent line to the curve. The second point is at the end of the transition, then another tangent line to the curve is drawn. In the curve that exhibit the maximum slope of the transition, a third tangent is drawn. Then it is considered a mid-point of these interpolation curves. Actually, the DSC test machine has a proper software that performs this tangent line procedure. The important detail is that the test speed should be kept at 20 °C/min. Since the glass transition temperature is a parameter that is strongly dependent on the cooling or heating speed, because the material molecules have a different time to arrange. Hence, it is realized in different states depending on the test speed. The sample is quite small, weighing about 10 mg, which is enough to measure important transformations from the point of view of chemical reactions.
ASTM E2160-04
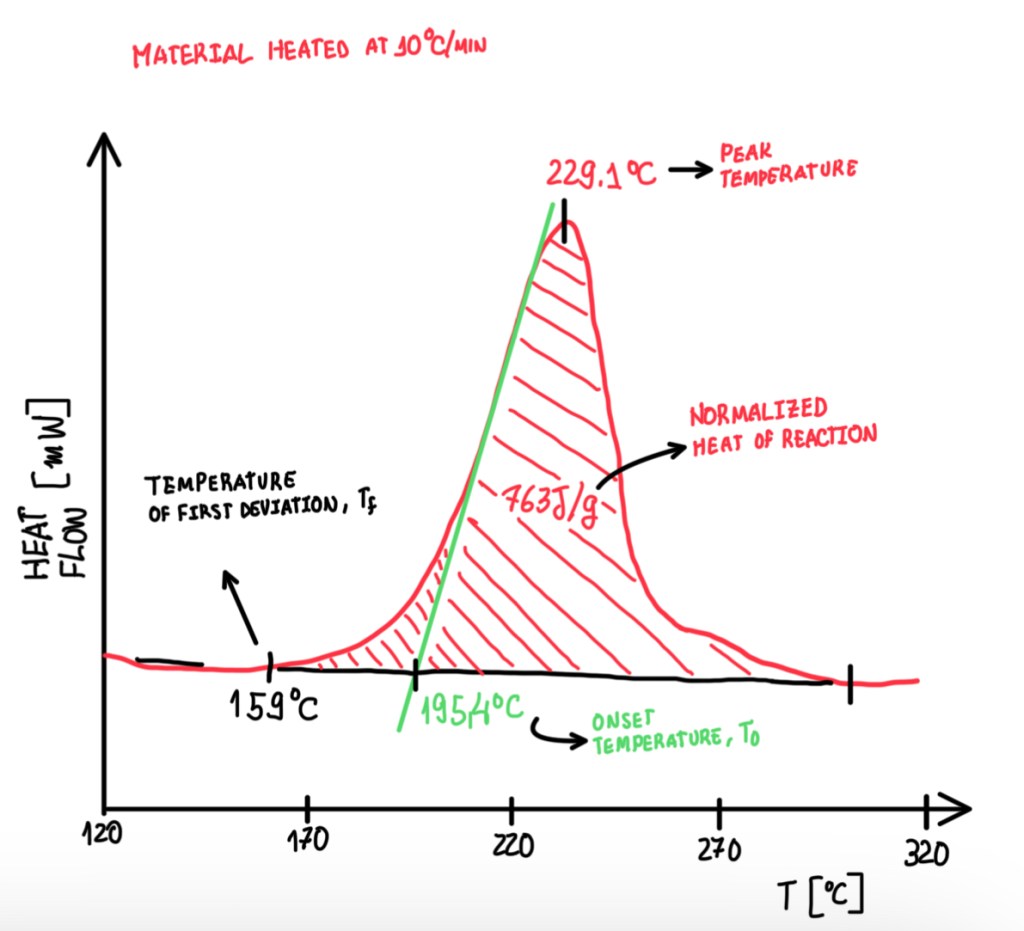
The second standard is ASTM E2160-04, which is based on the heat of the reaction. In this case, the reaction rate is lower 10 °C/min. The main parameters are the peak temperature, the onset temperature (T0), the first deviation temperature and the normalized heat of the reaction. The first parameter is the highest temperature reached by the reaction. The onset temperature is the one that is considered a point far from the peak, this is a point with the maximum slope which is drawn between the two tangents. Another temperature is the first deviation one, this indicates the start of the transition. In other words, the first point which is observable the deviation from the baseline. Usually, T0 and peak temperature are the main parameters reported.
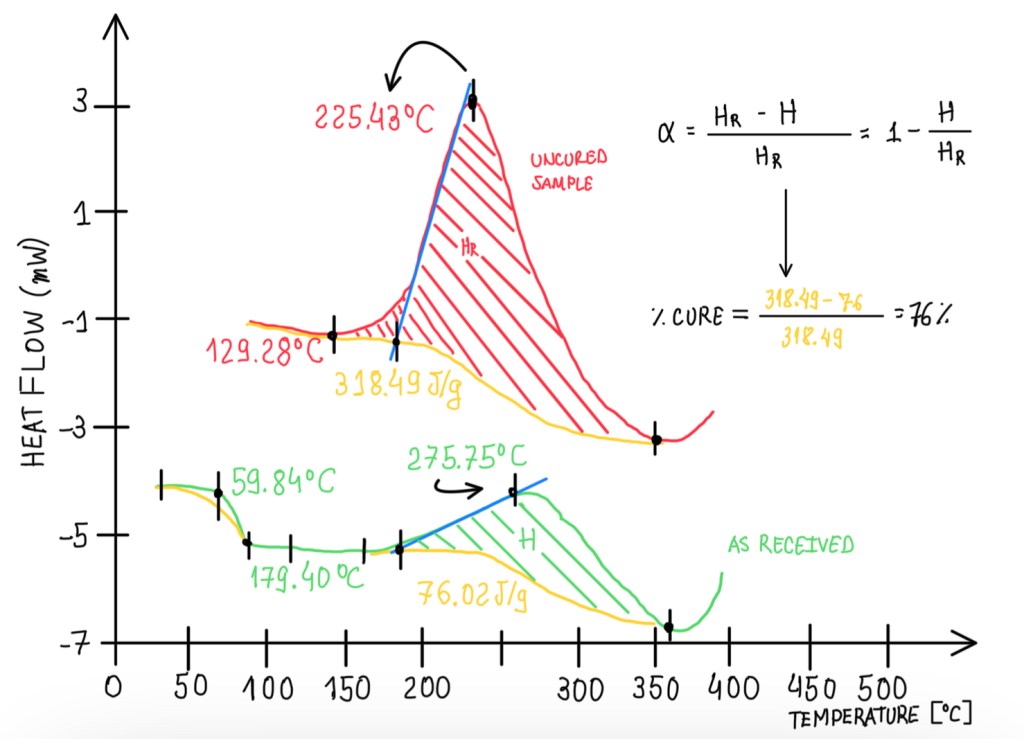
The normalized heat of reaction is the area underneath the peak. To calculate it, it is necessary to perform the integral of the curve. This value is usually reported in a normalized form, because it allows comparisons between different materials and samples. Otherwise, the values are specific, depending on the mass of the materials, these will be strongly dependent on how much material is inside of the pan. The integration of the curve starts from the first deviation temperature. The interest regarding the normalization of the heat of the reaction is to measure the curing degree. Hence, it is measured in uncured and partially cured samples. Then by comparing the uncured and partially cured sample heat of reactions, Hr and H respectively, it is possible to calculate α, which is the curing percentage. This is a measurement normally performed for all materials that are exposed to a DSC test. Another measurement is the reaction kinetic. This is based on two methods, the chemical reaction between two functional groups, A and B, which is called condensation and addition, and the chemical reaction between functional groups A, the radical reaction. In any case, the kinetic studying evaluates the concentration with respect to the initial concentration. Hence, it is possible to write:
C* = (CA0 – CA)/CA0
Where C* is the cure percentage, CA0 is the initial A concentration and CA is A concentration at a time t. This considers two different parts of the polymers. These are analyzed regarding their concentration changing as a function of time. This approach can not be done in the case of chemical reactions with the functional groups, the so-called radical reaction which is specific to some polymers. Another approach is the addition reaction, which means that the chains grow by adding new links and new monomers. As a matter of time, the degree of cure can be defined by considering how many groups have been added to chain polymers once it is fully realized.
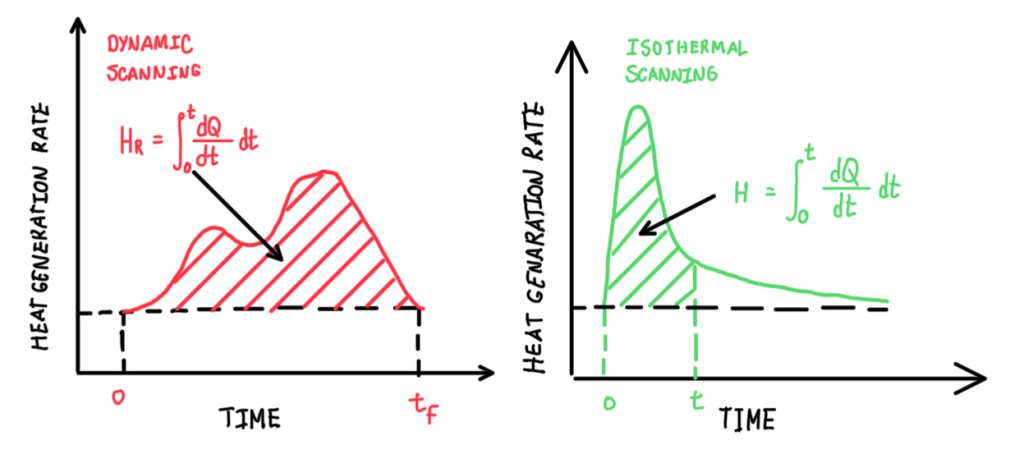
These two tests (Figure 9) are very specific, they are only performed when it is necessary to know the full process of cure for the manufacturing process as autoclave or compression molding. The most common approach is cure percentage test, in order to understand if the sample is fully or partially cured, then determine which is the percentage of cure with respect to the related one.
References
- Standard Test Method for Transition Temperatures and Enthalpies of Fusion and Crystallization of Polymers by Differential Scanning Calorimetry, “ASTM D3418-12, vol.08.02. DOI: 10.1520/D3418-12E01;
- Blog Naver;
- Woo Il Lee, A. Loos. Heat of Reaction, Degree of Cure, and Viscosity of Hercules 3501-6 Resin. G. Springer, Materials Science, Journal of Composite Materials, Published 1 November 1982. DOI:10.1177/002199838201600605;
- This article was also based on the lecture notes written by the author for during the Design for Composite Structures of Racing Car lectures attended at Università di Modena e Reggio Emilia.
